
HOW TO CAPTURE AND CHECK THE INTENSITY OF A SOLAR FLARE
I initially check the NOAA X-ray Flux graph and keep it open on the side of my PC screen this updates every few minutes so you can watch for the rapid upwards curve that heralds a solar flare. You can also keep the most relevant of the six GONG monitors open to check the location of the flare and the most active part of the disc whether it be a flare or prominence etc?
Once a flare has gone off the NOAA graph will give a rough indication of its magnitude. I have included an example below that shows what appears to be an M2-class event on the 3 June 2012. The precise magnitude may follow a few hours later after the NOAA duty forecaster has had a chance to check all the available instrumentation/data and posted it on the Edited event log and the log for the last 60 days. These are then posted on an edited events log and part of which is posted below with the precise intensity being highlighted in red text. This event on the 3 June 2012 was assigned an M3.3-class magnitude.
There is also a very useful Solarmonitor link to check the magnitude of solar flares.
7360 + 1257 //// 1321 SAG C RSP 034-180 VI/1
7360 1257 //// 1305 SVI C RSP 047-180 III/1
7360 + 1259 1259 1259 SVI G RBR 245 160
7370 + 1507 //// 1513 SAG C RSP 025-180 III/2 1496
7370 1511 1516 1535 HOL 3 FLA N16E38 SF ERU 1496
7370 + 1513 1513 1513 SAG G RBR 245 220 1496
7380 1514 1515 1529 SVI 3 FLA N19E38 SF 1496
7390 1537 1537 1540 HOL 3 FLA S26W83 SF
7400 + 1609 //// 1610 SVI C RSP 040-082 III/1
7410 + 1748 1755 1757 G15 5 XRA 1-8A M3.3 7.0E-03 1496
7410 + 1750 //// 1755 SAG C RSP 025-180 V/2 1496
7410 + 1751 1754 1755 SAG G RBR 245 13000 1496
7410 + 1751 1754 1755 SAG G RBR 410 25000 1496
7410 + 1752 1753 1754 SAG G RBR 2695 320 1496
7410 + 1752 1753 1754 SAG G RBR 4995 340 1496
7410 + 1752 1753 1754 SAG G RBR 8800 550 1496
7410 + 1752 1754 1755 SAG G RBR 610 500 1496
7410 + 1753 1753 1755 SAG G RBR 1415 210 1496
7410 + 1753 1753 1757 SAG G RBR 15400 320 1496
7410 1753 //// 1817 SAG C RSP 025-150 II/2 760 1496
Solar Flare Magnitudes: Here is a useful video guide by NASA
There are lots of solar flare captures on my website and so here is a chance to view them all in chronological order of magnitude starting with the largest at the top. They are all my own work except where others obtained the initial data there is a credit to the right hand side. The date and universal time is included in the file names of my movies. Further, here is a list of the largest solar flares ever recorded since 1976. Here are the excellent movies made by the TRACE team of big solar events.
I am presently moving my files onto my photobucket site so some links may temporarily not work.
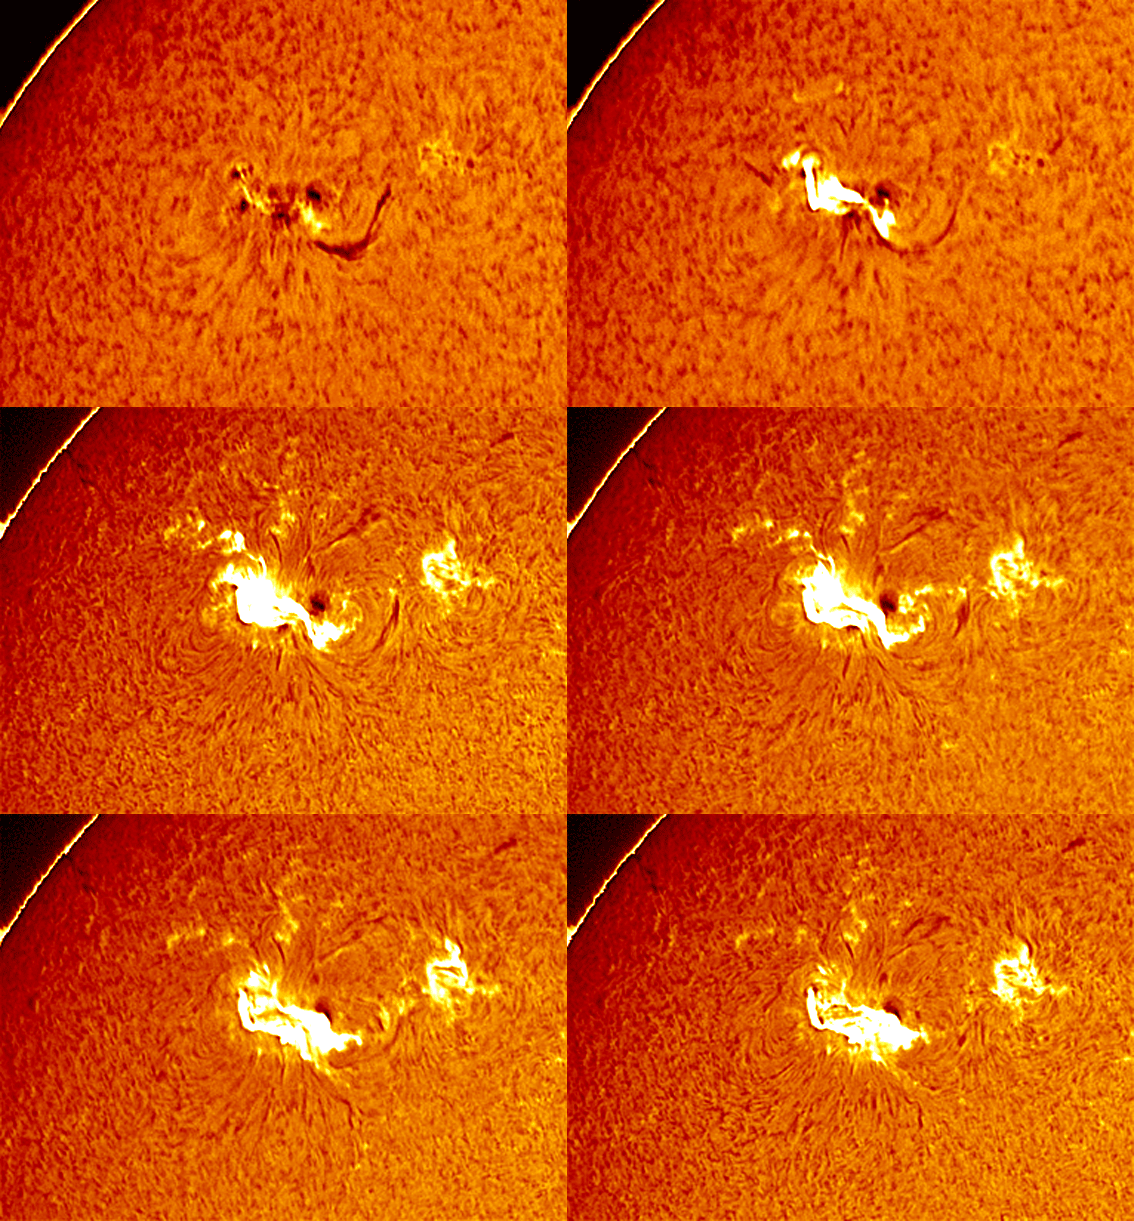

X3.6 Brigit Kremer
X3.1 GONG

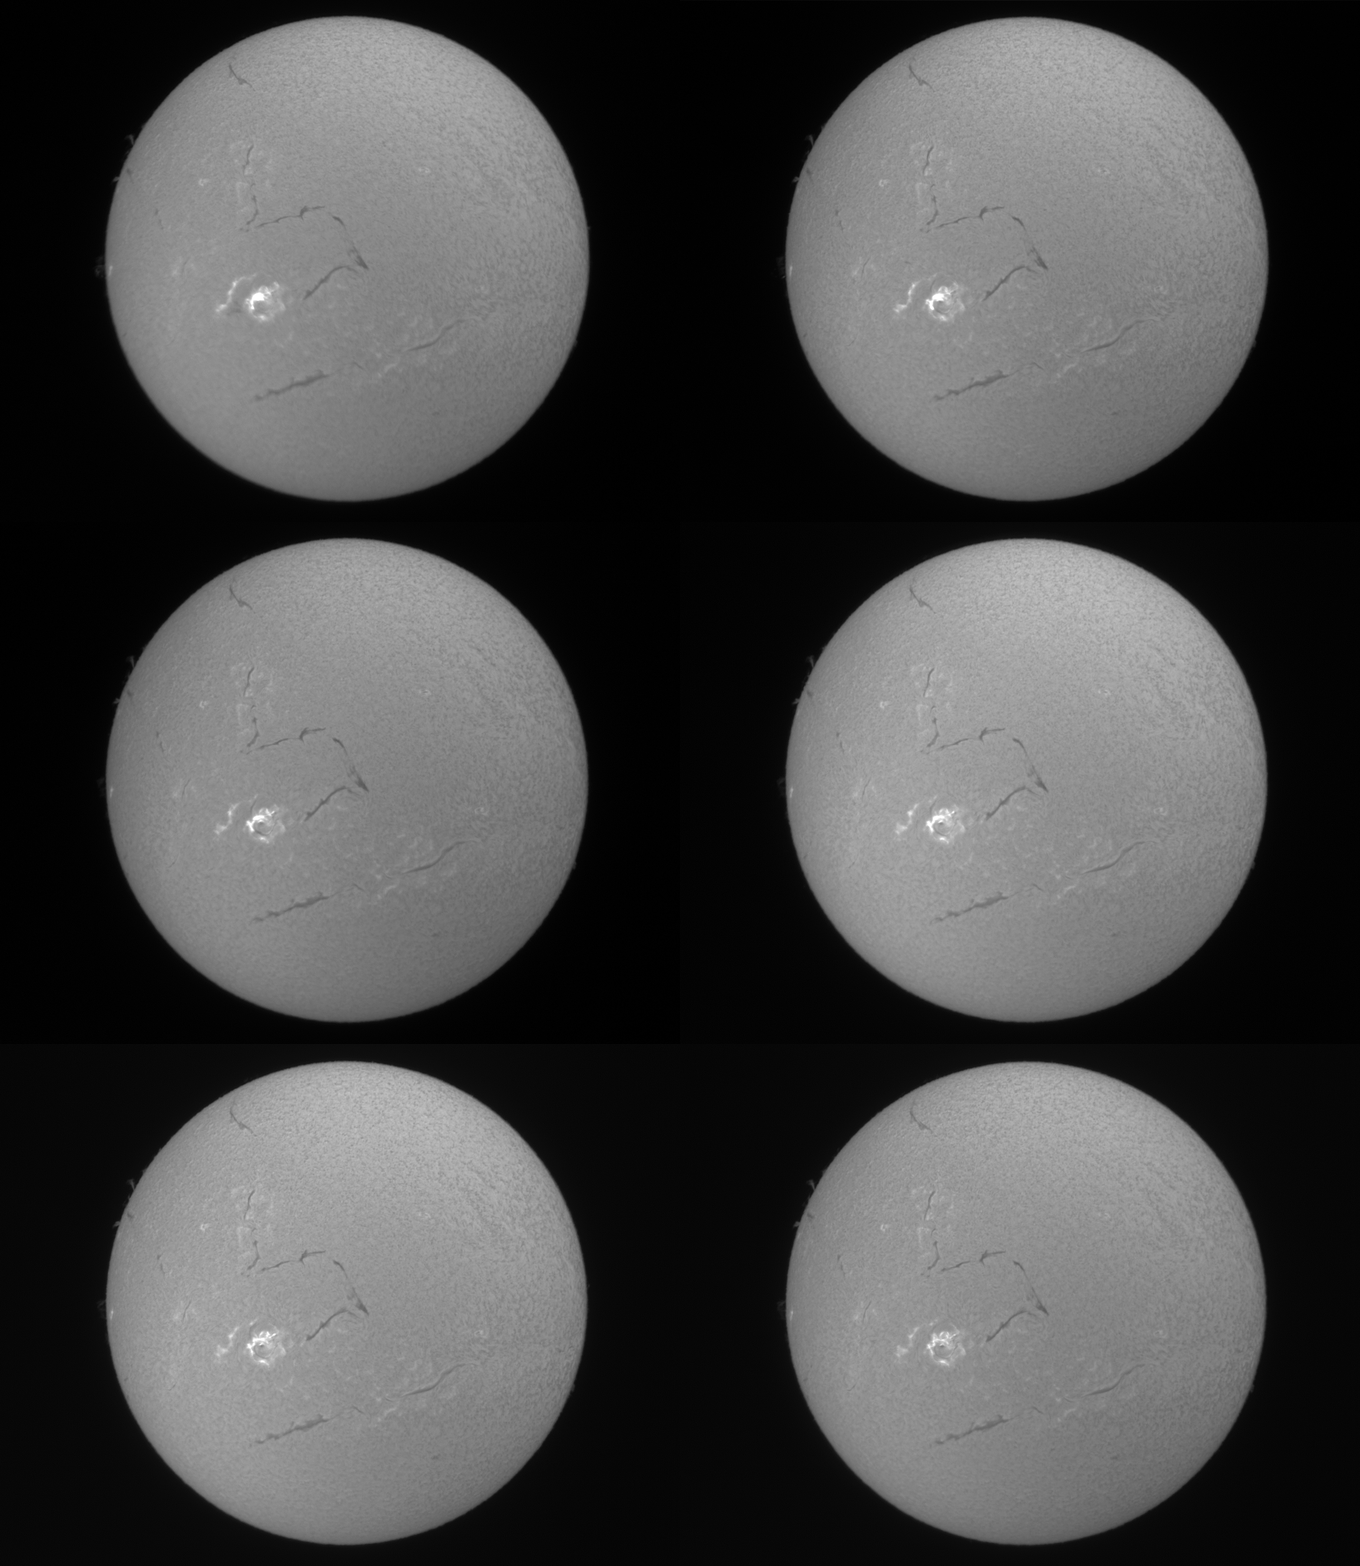


X1.8 GONG
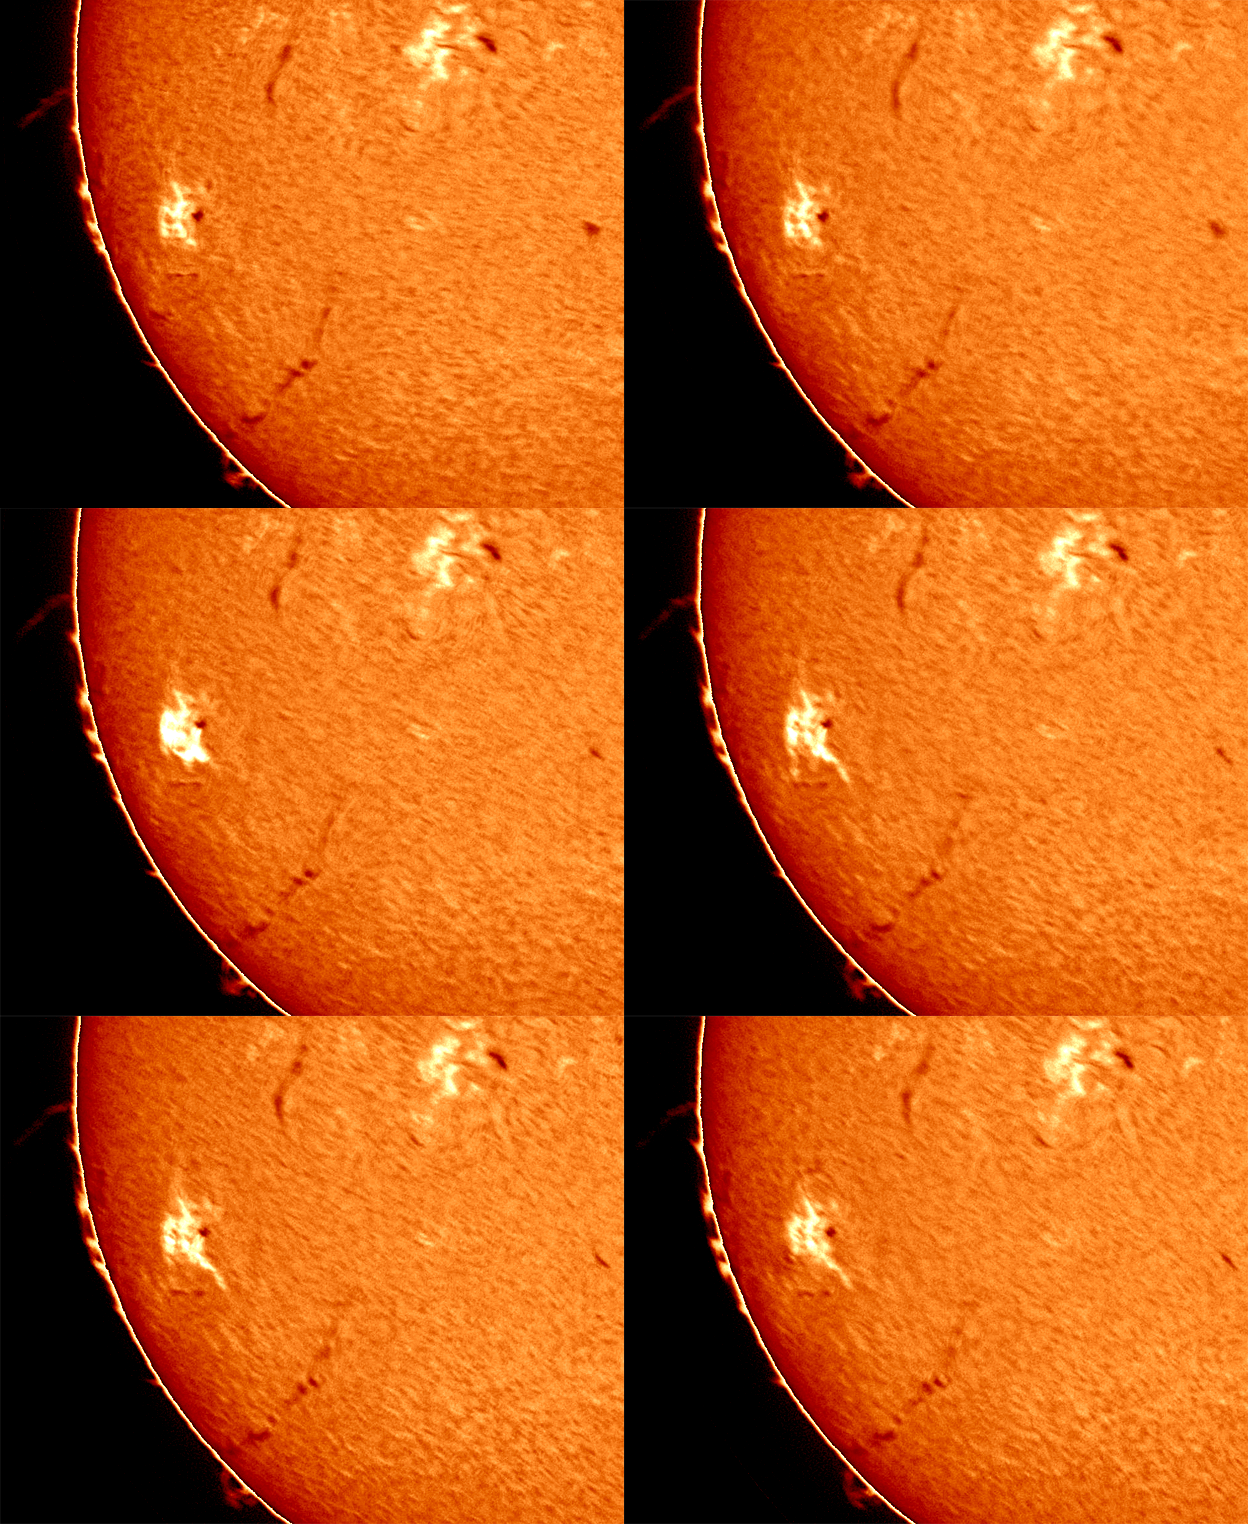
X1.8 GONG
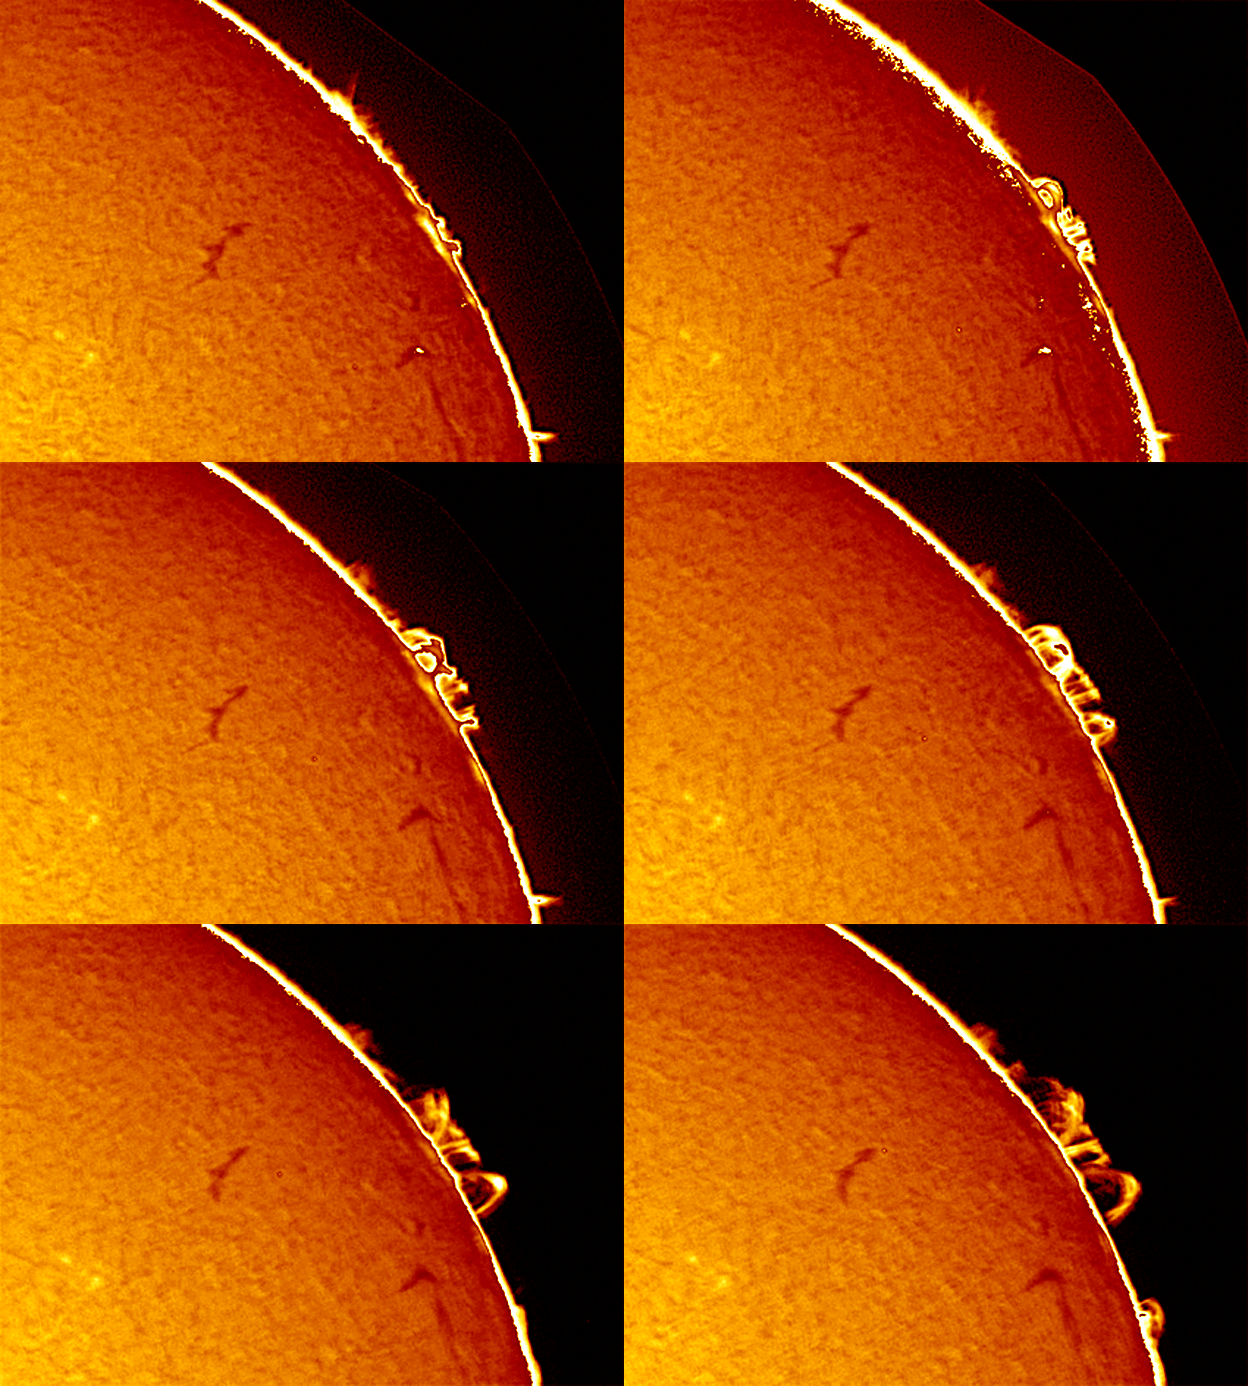

X1.8 Post flare loops only

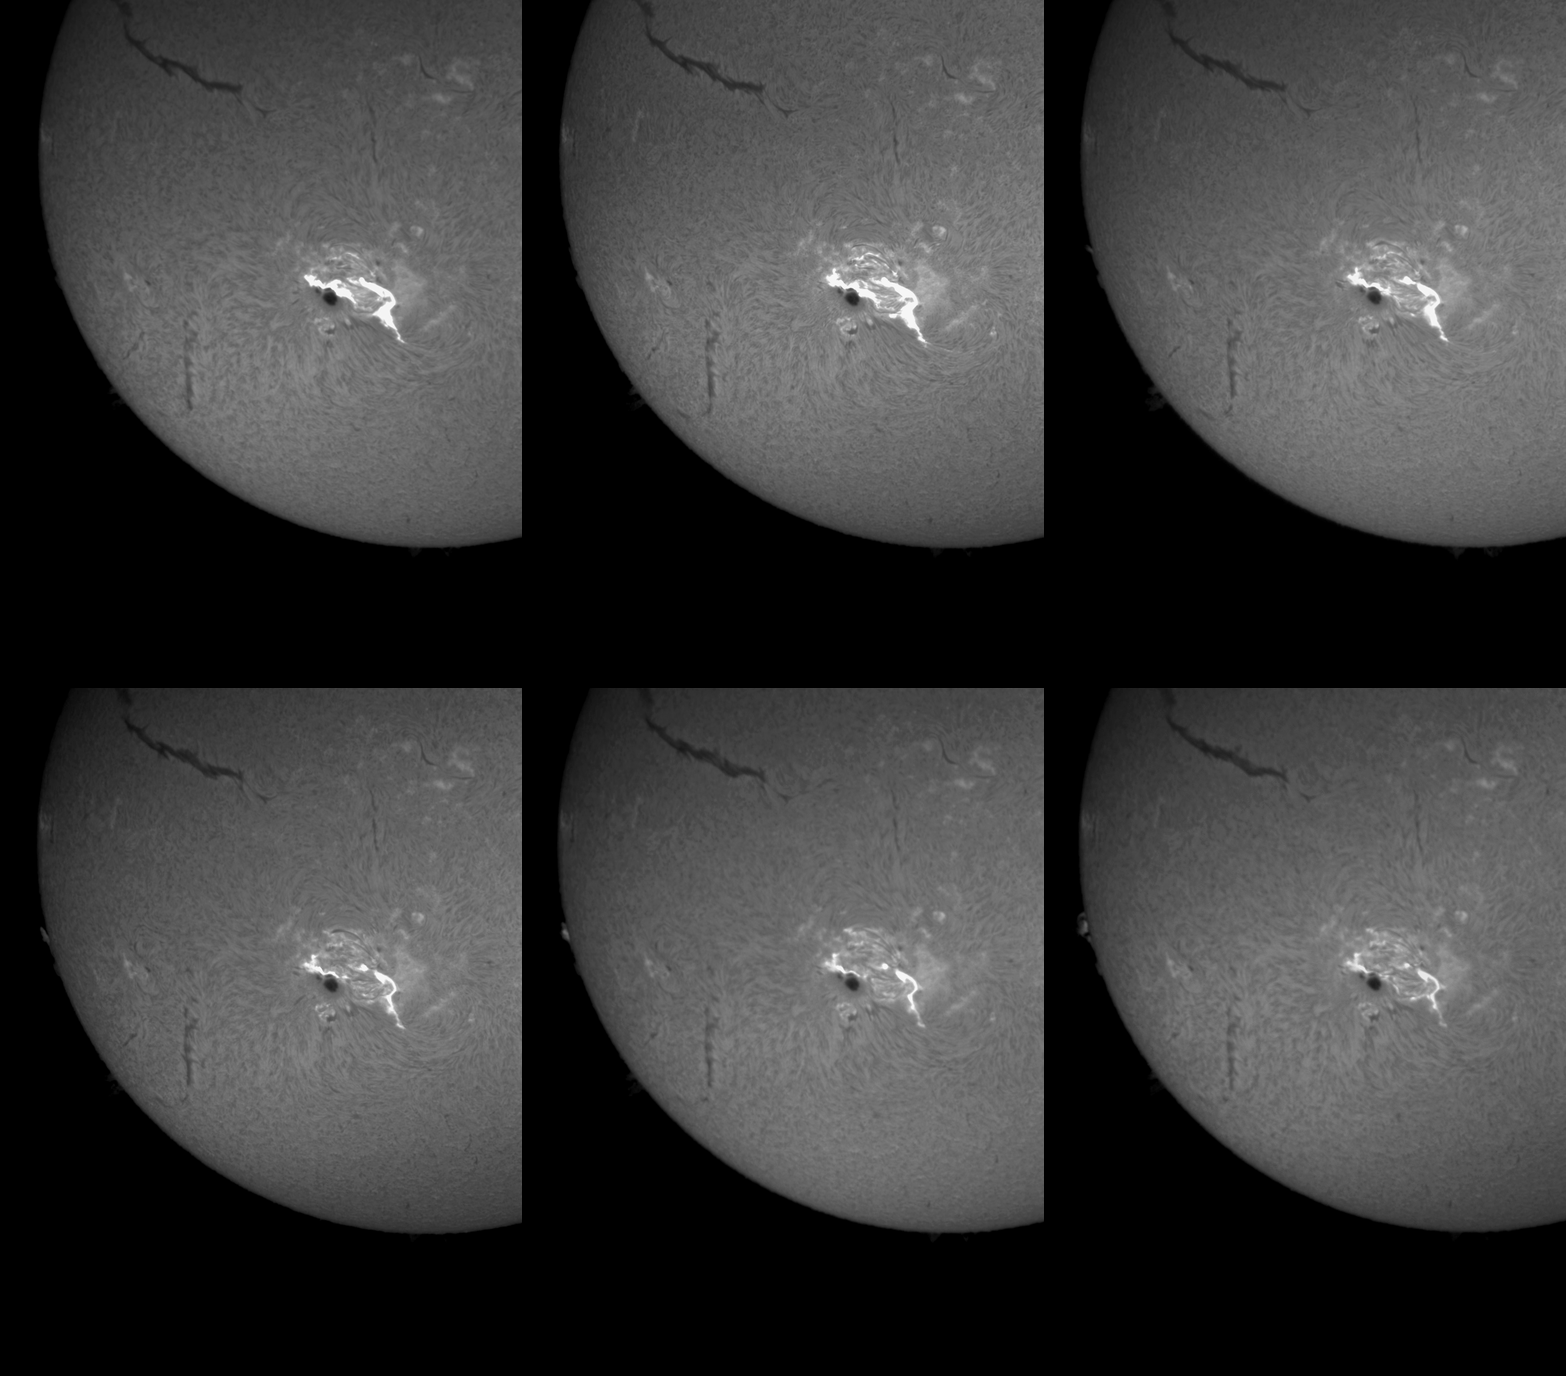
X1.6 Dave Snope and GONG full disc and close up


X1.4 GONG
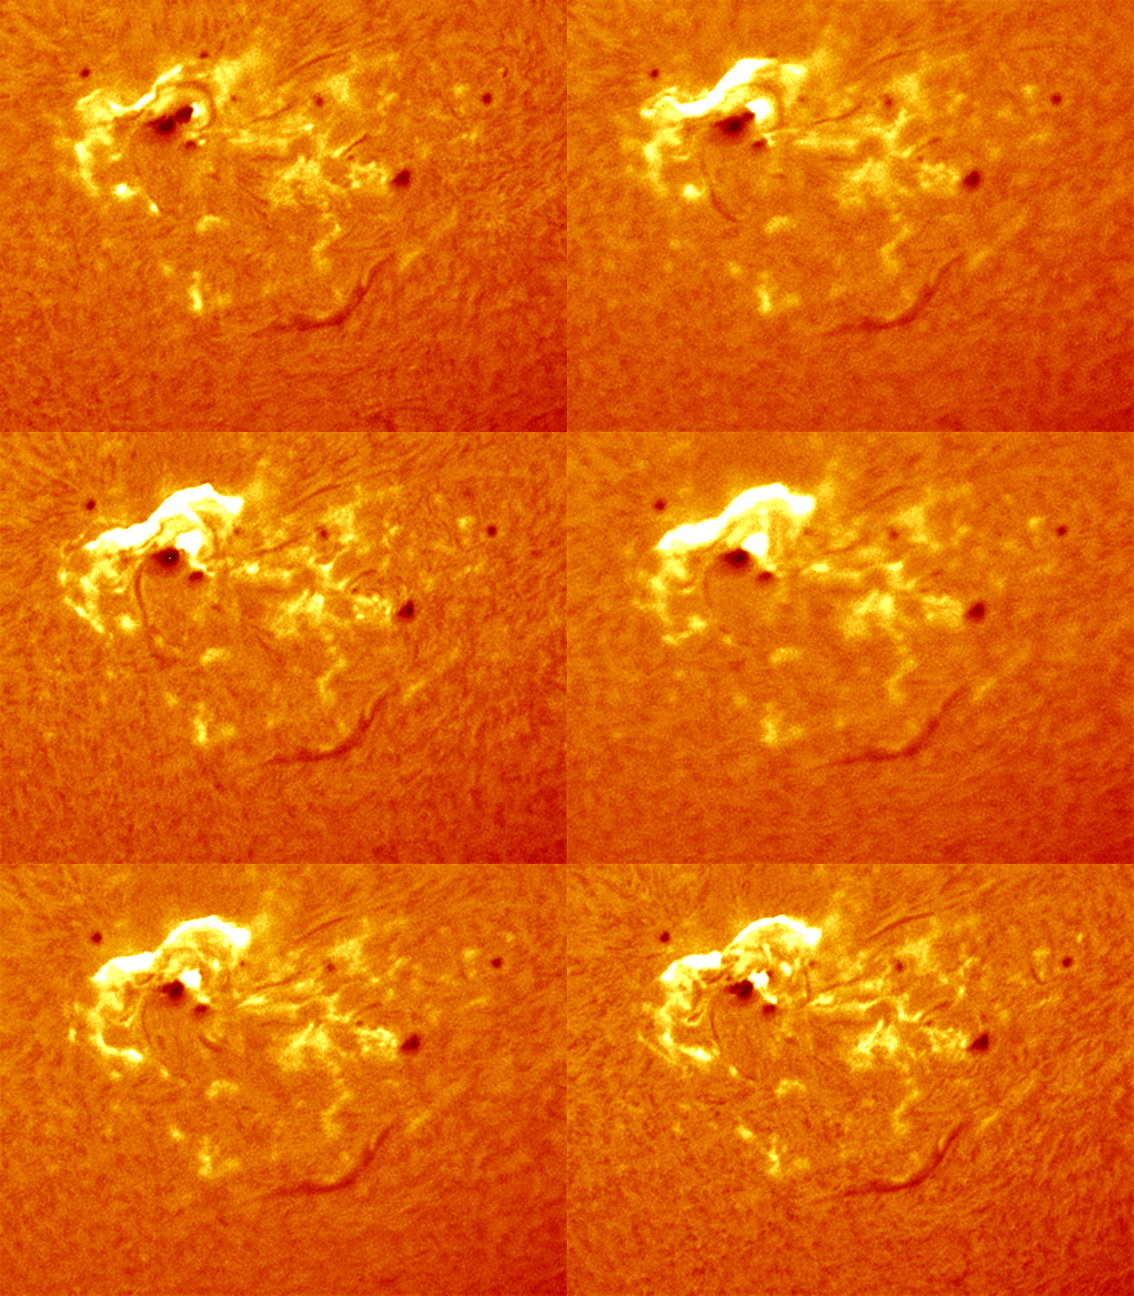
X1.1 GONG
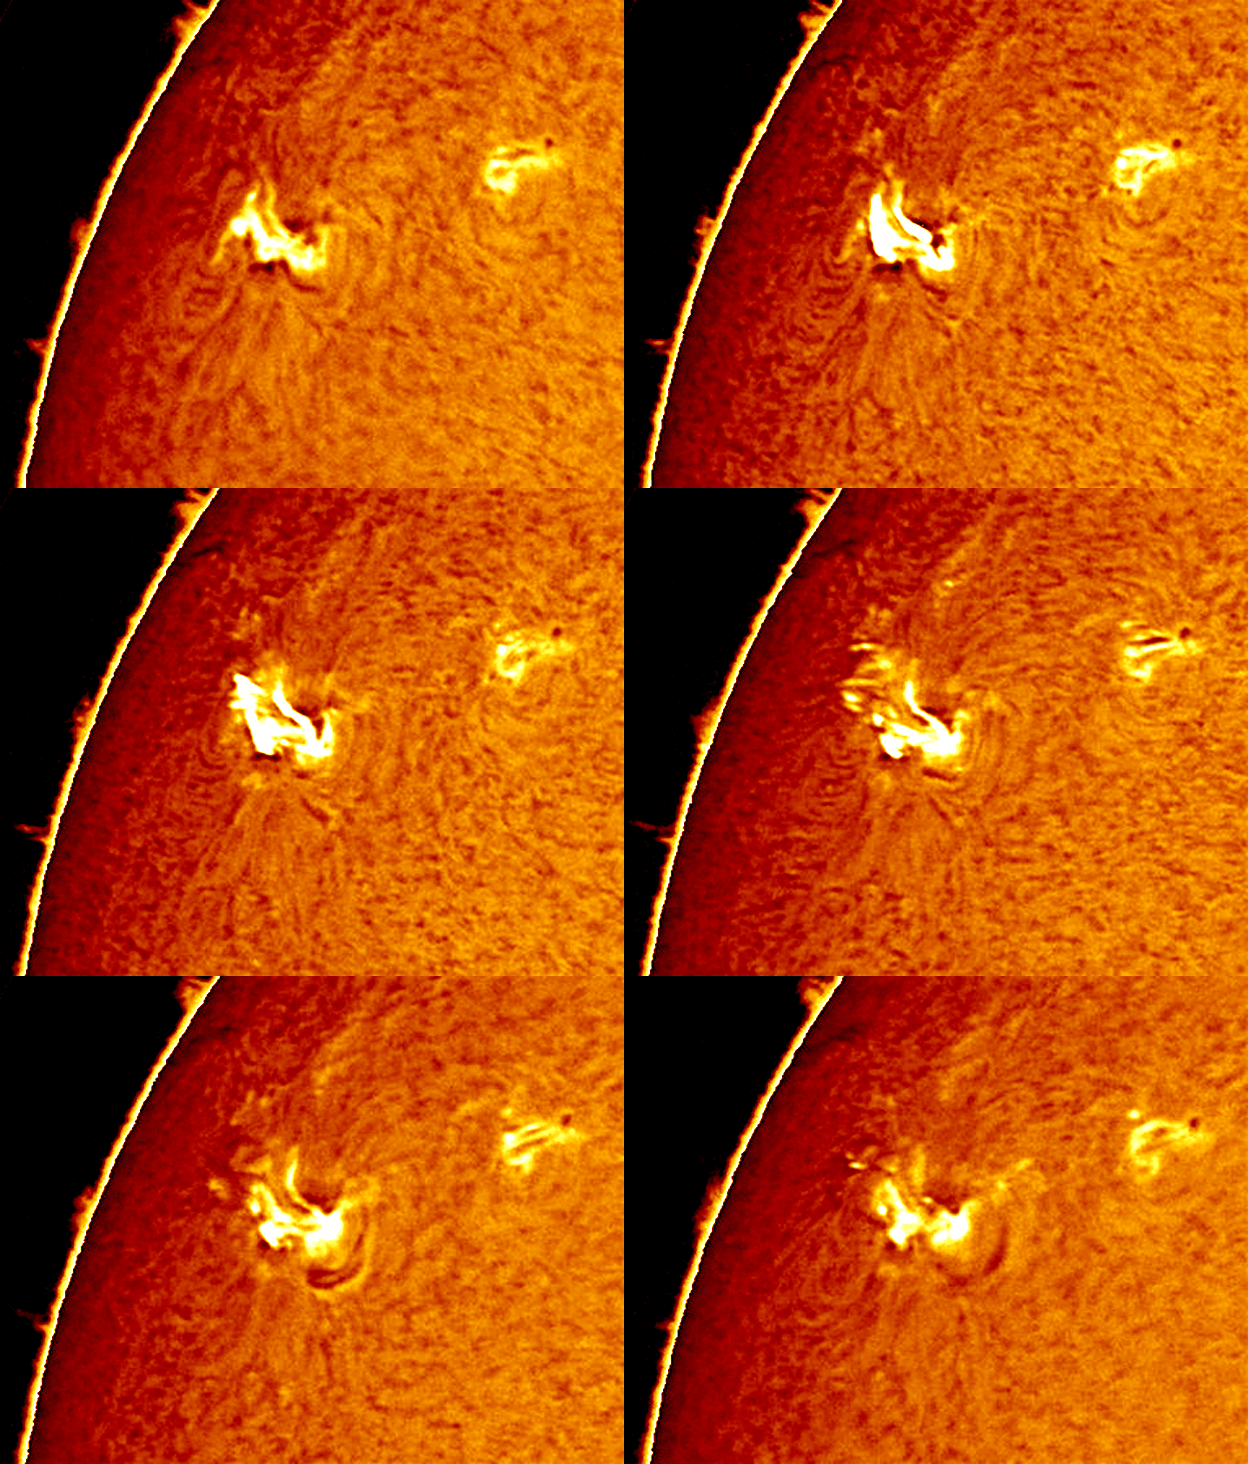
X1.1 GONG
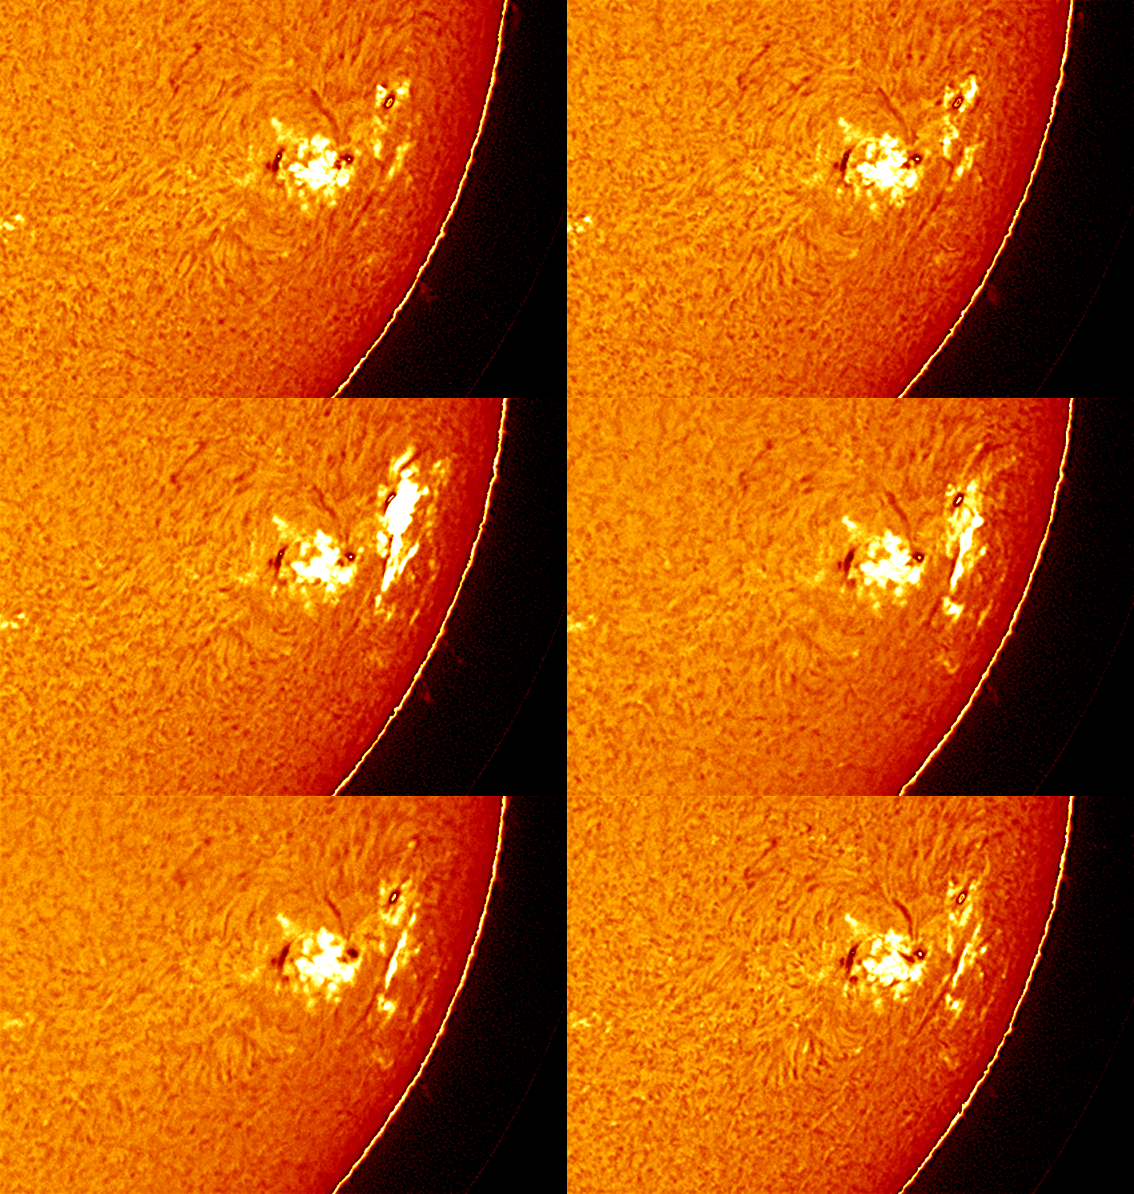
M8.7 GONG
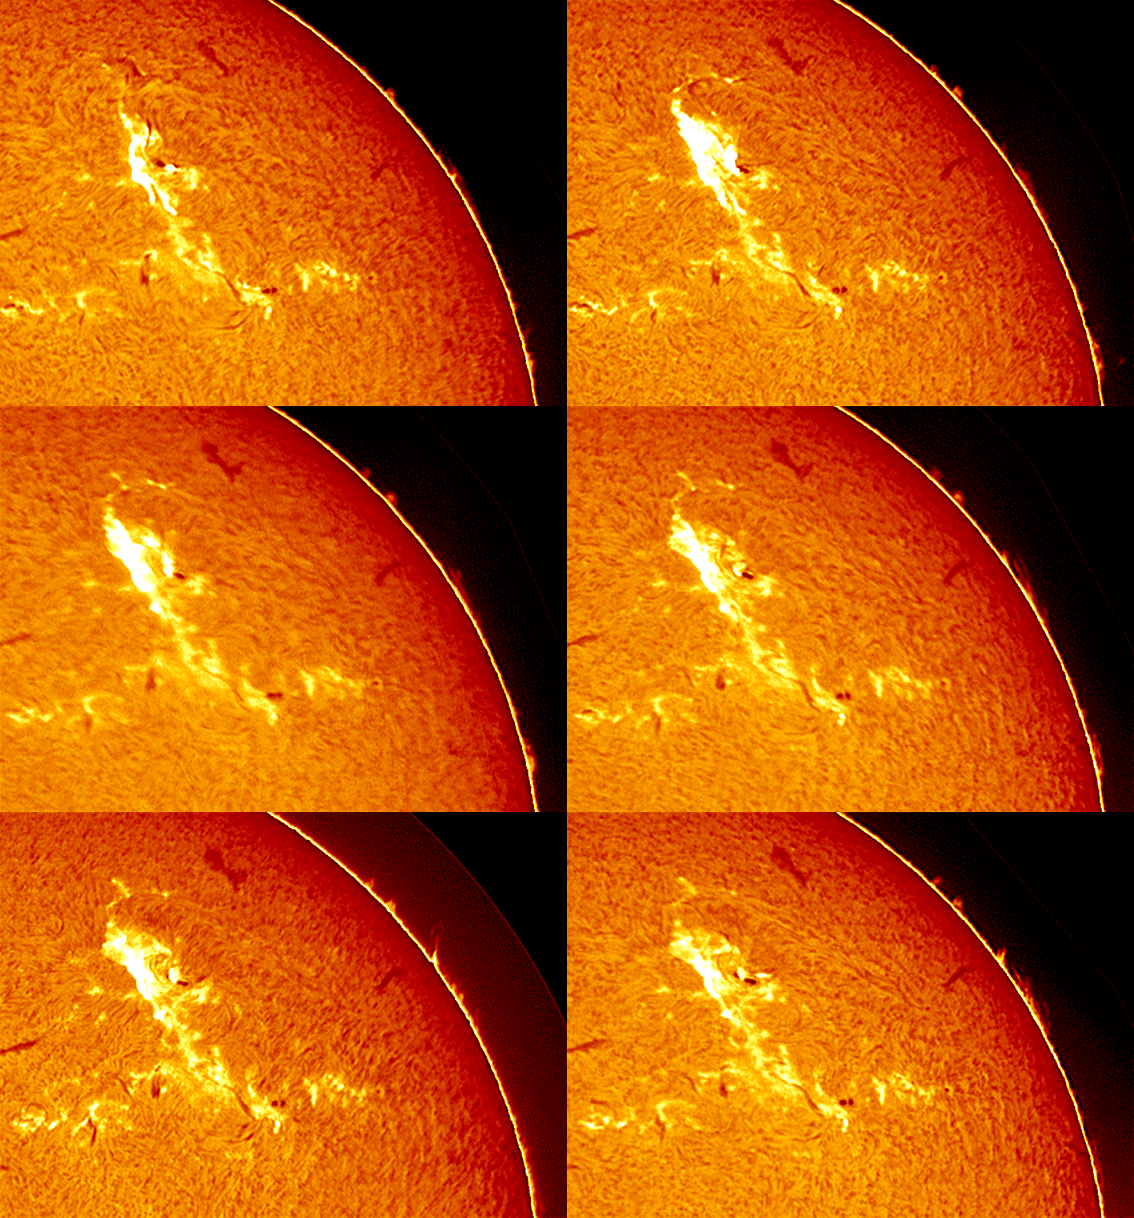
M8.4 GONG
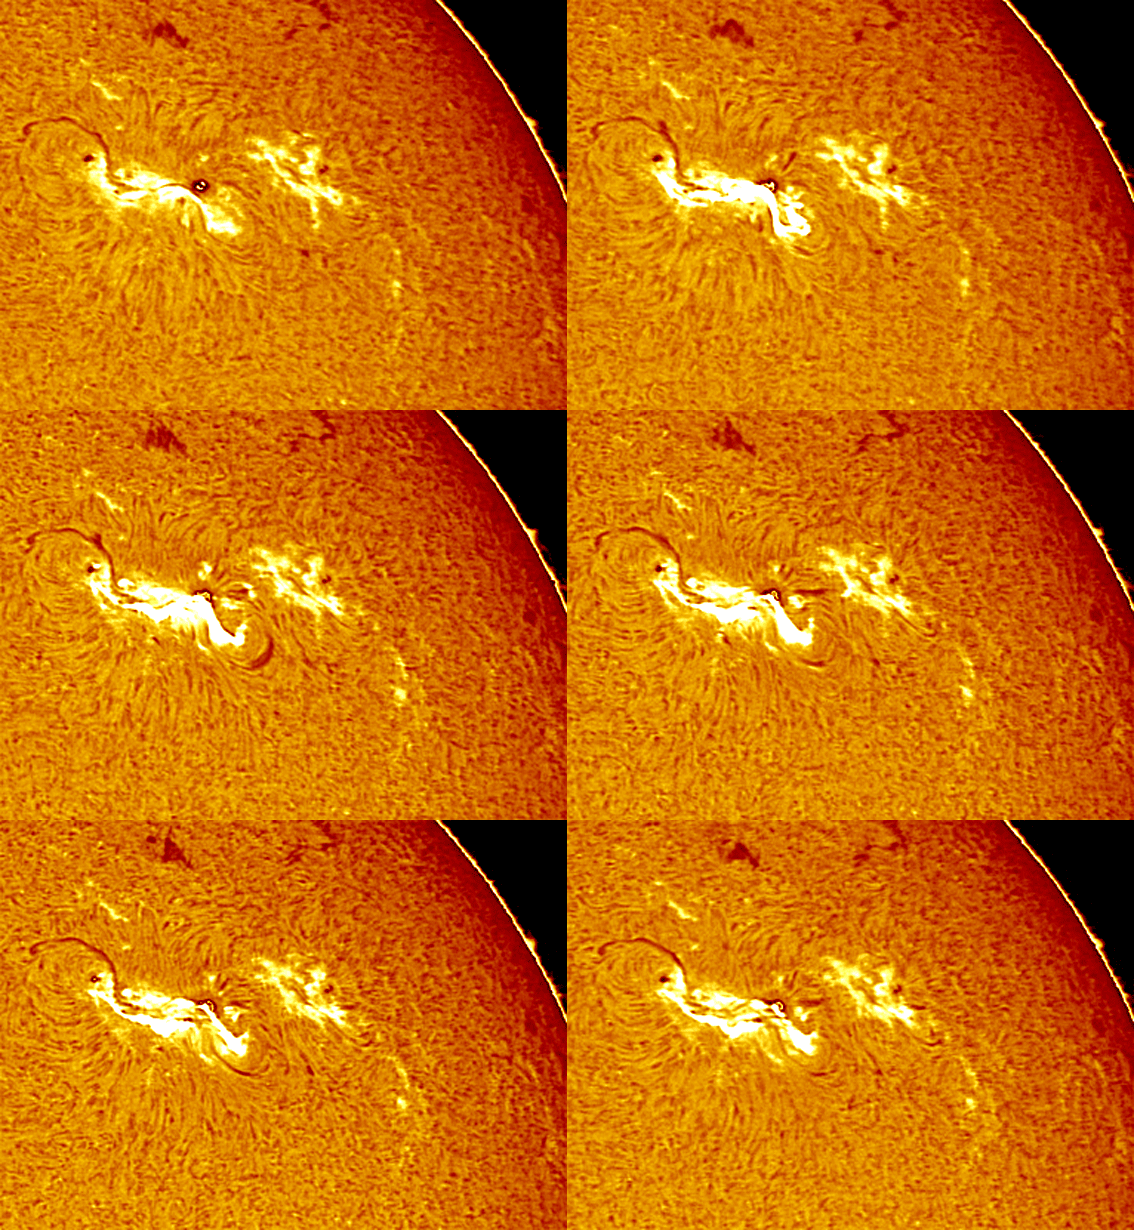
M7.9 GONG
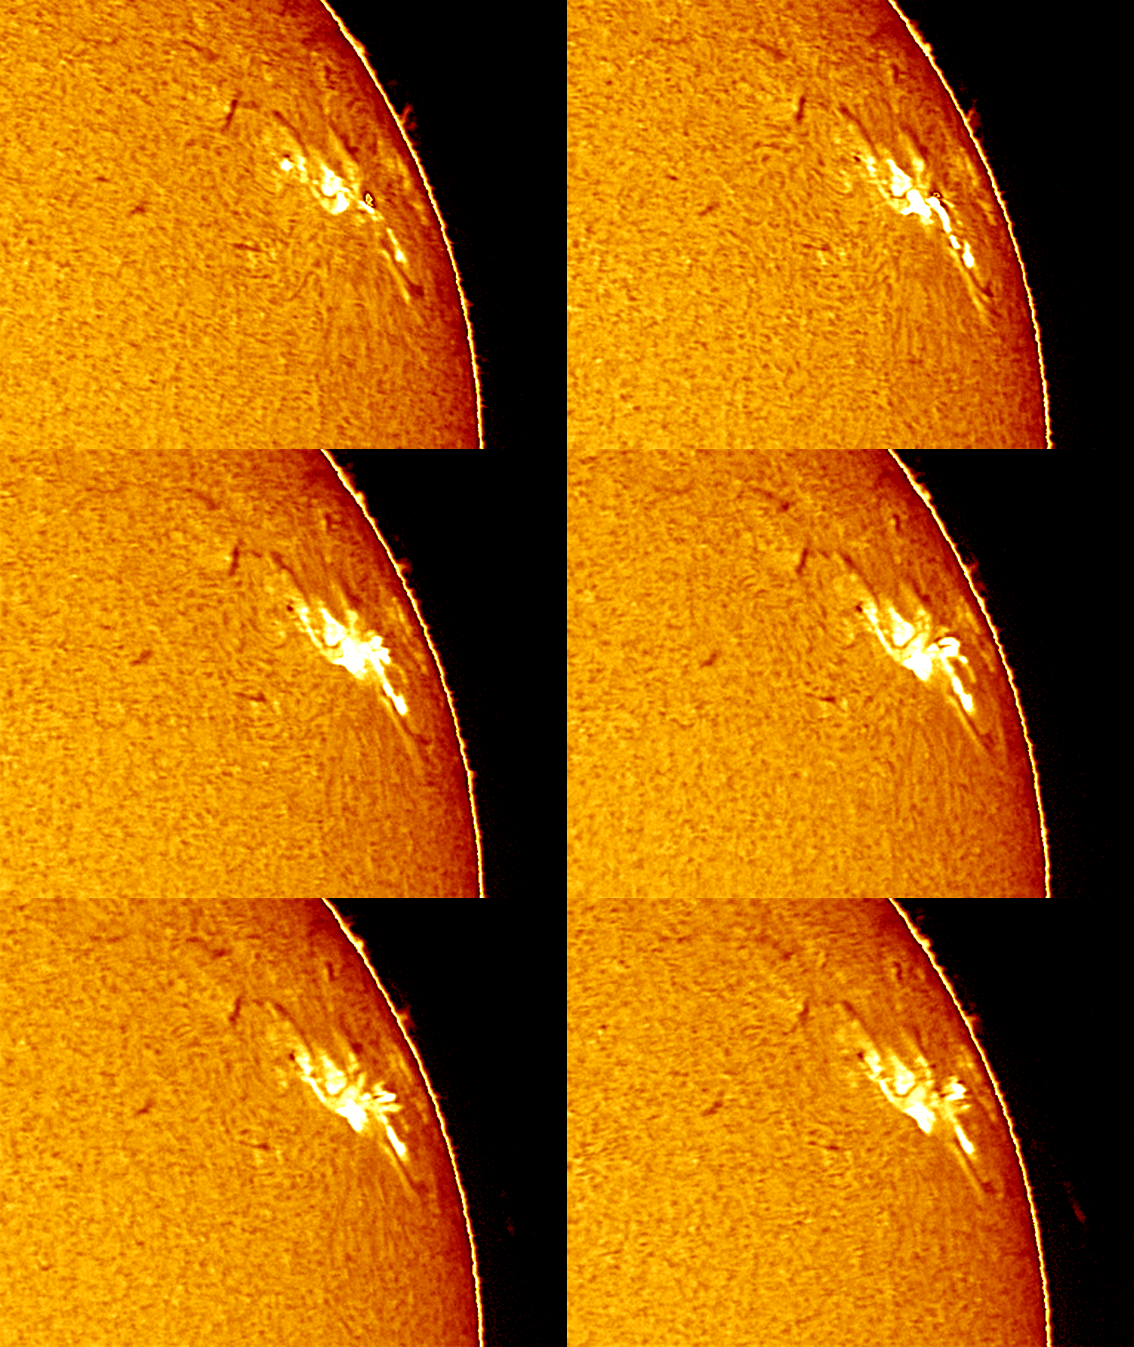
M7.7 Post flare loops only


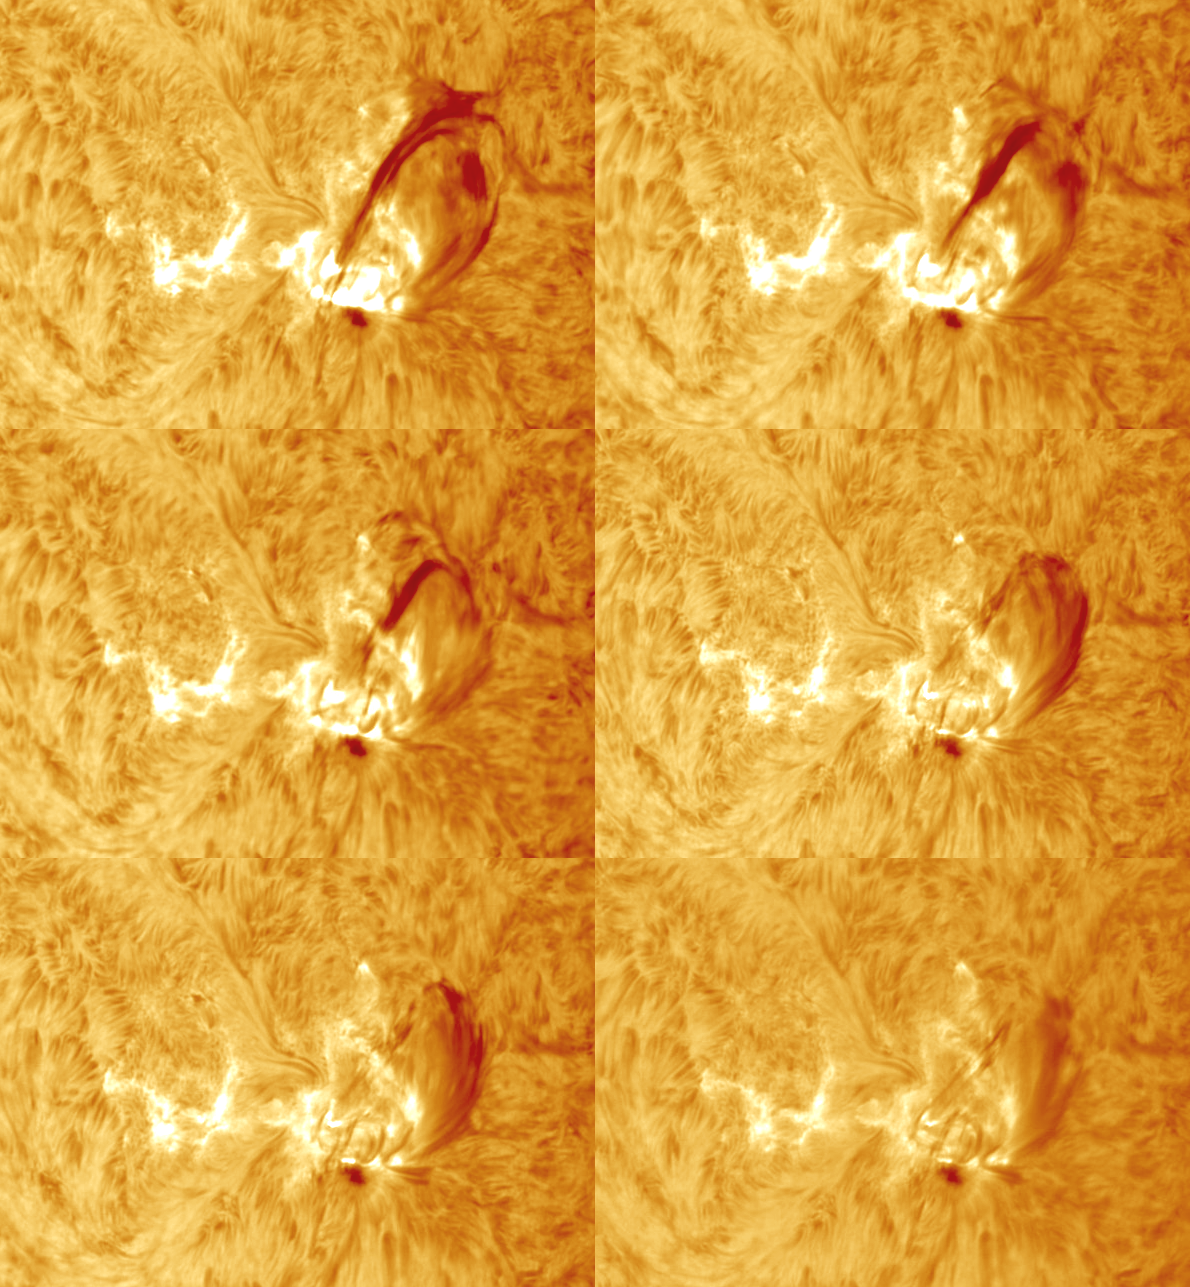
M6.3 GONG
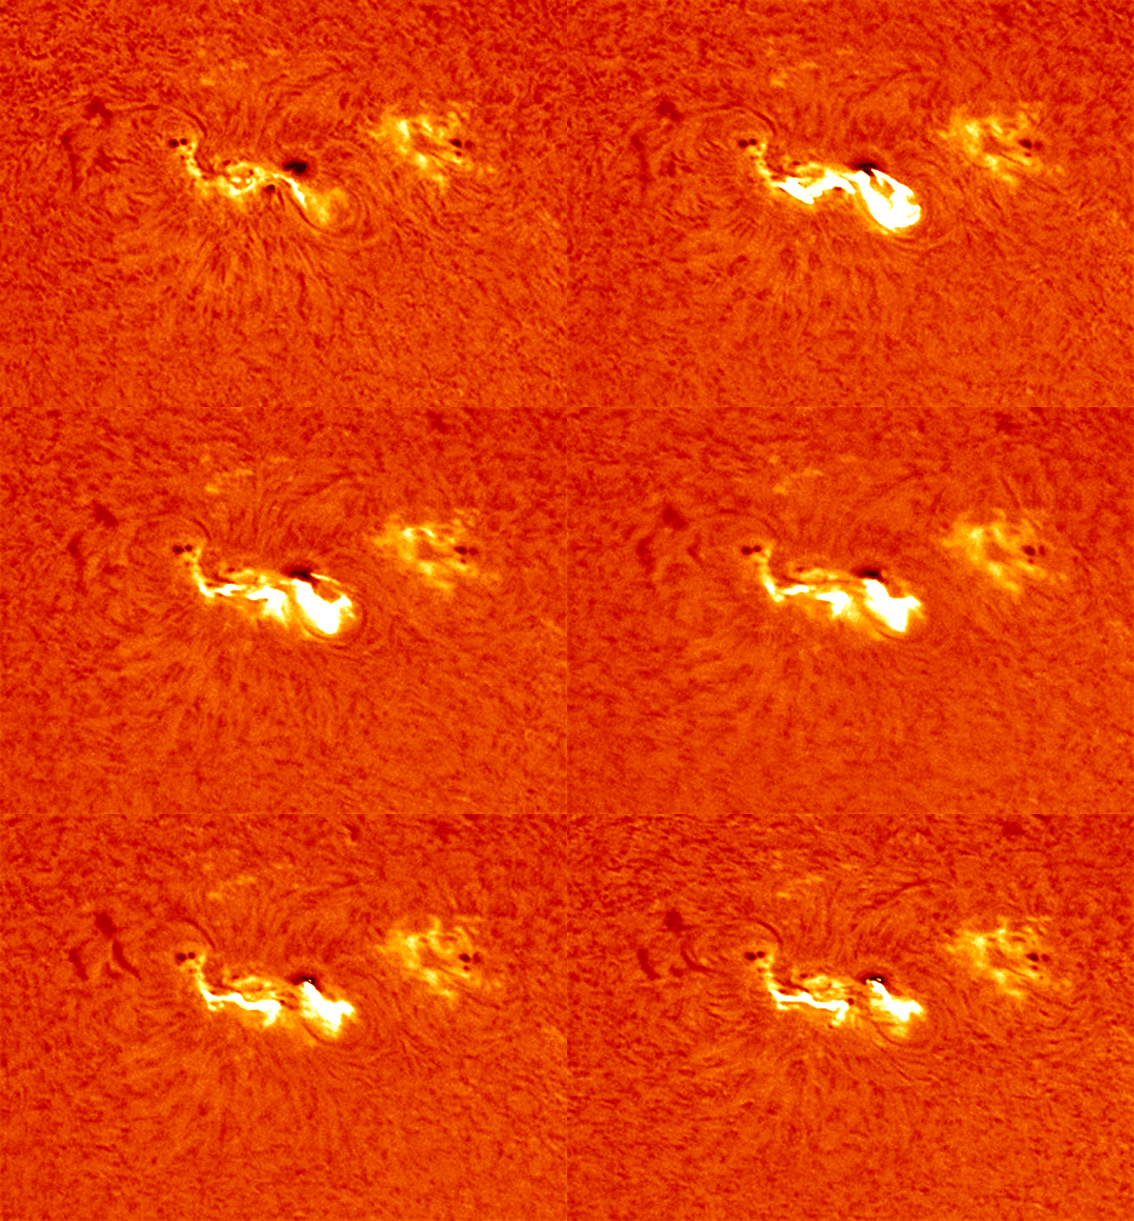
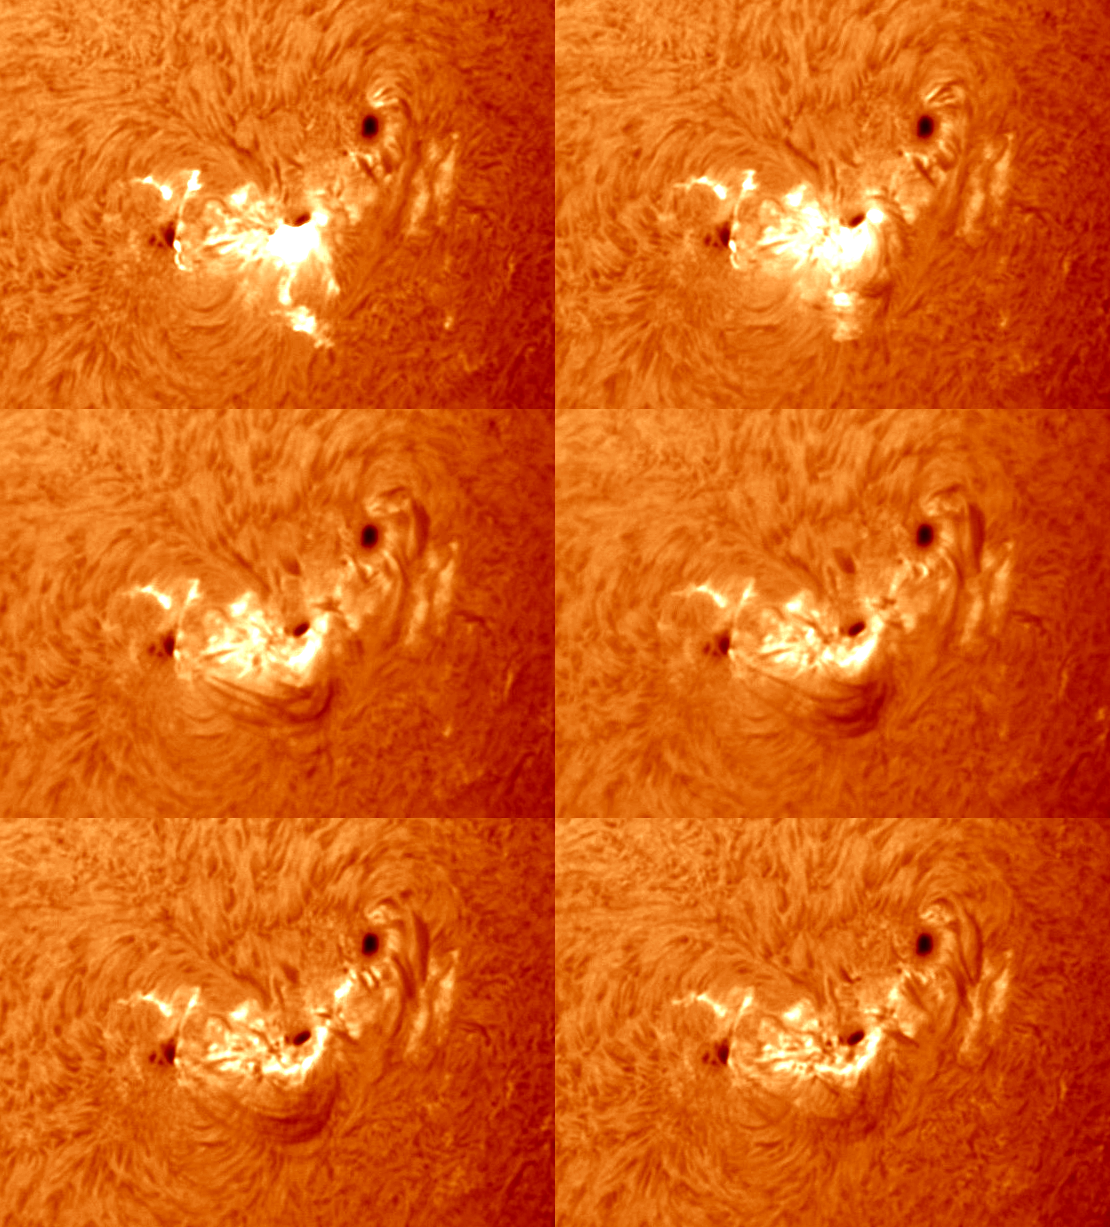
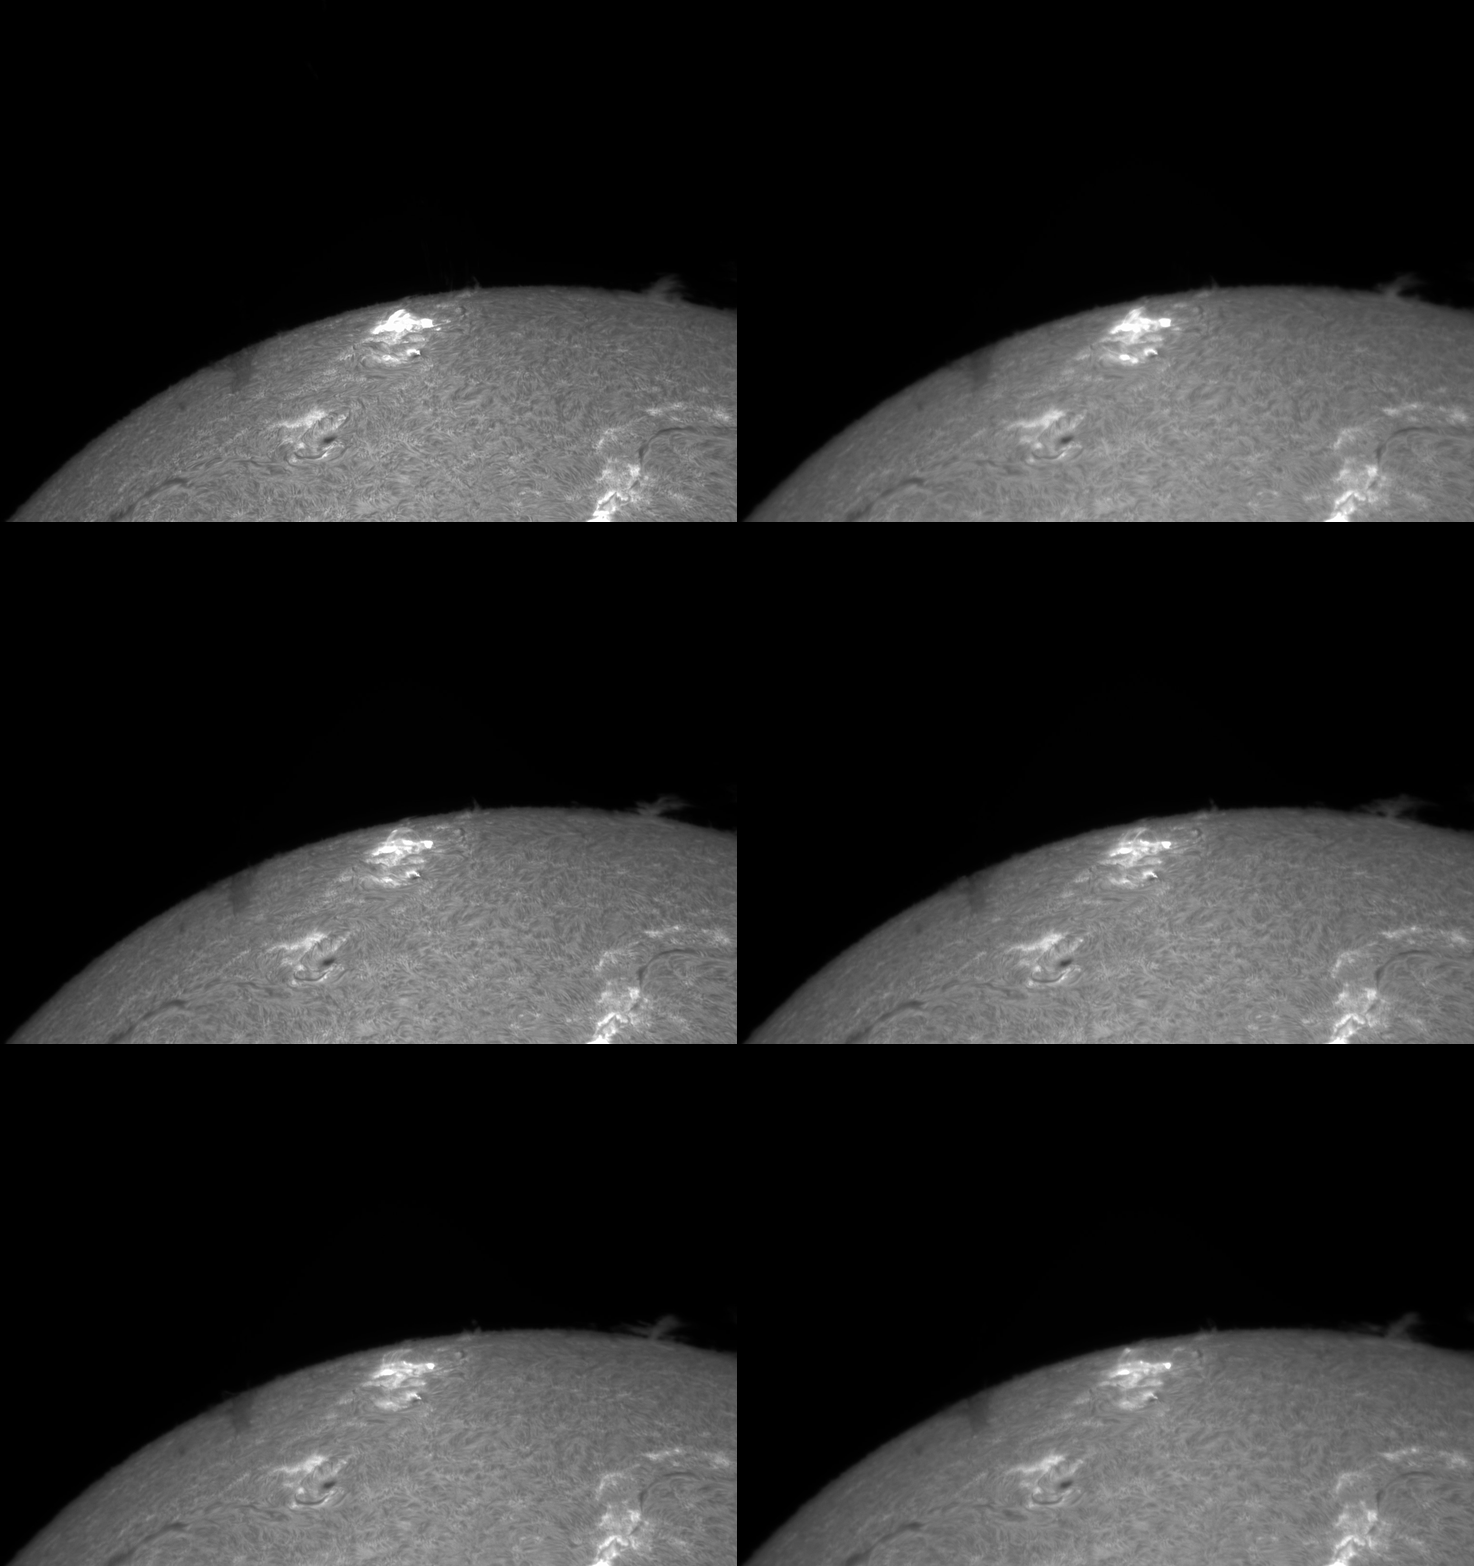
M5.7 David Maidment
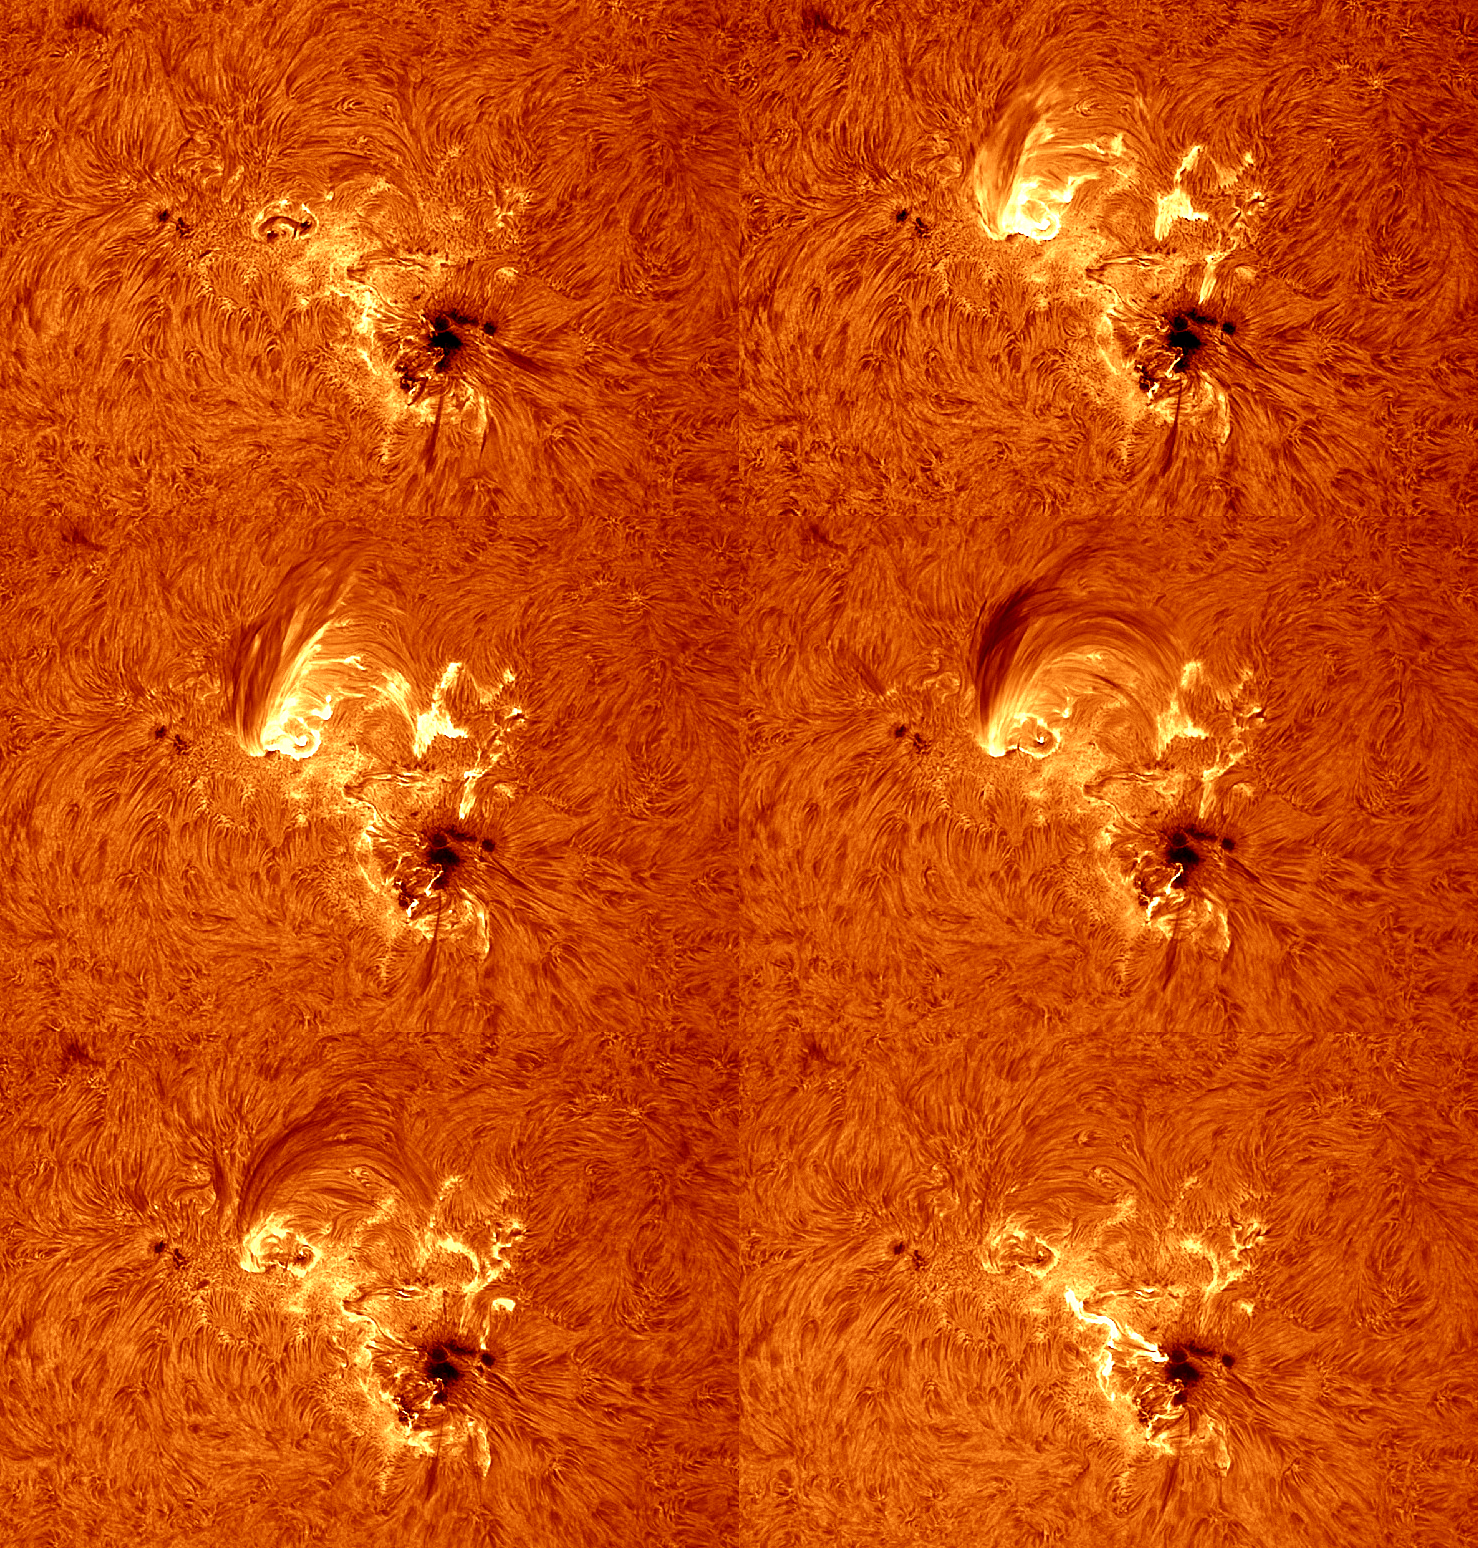
M5.6 GONG and the same event in high res by Viljo
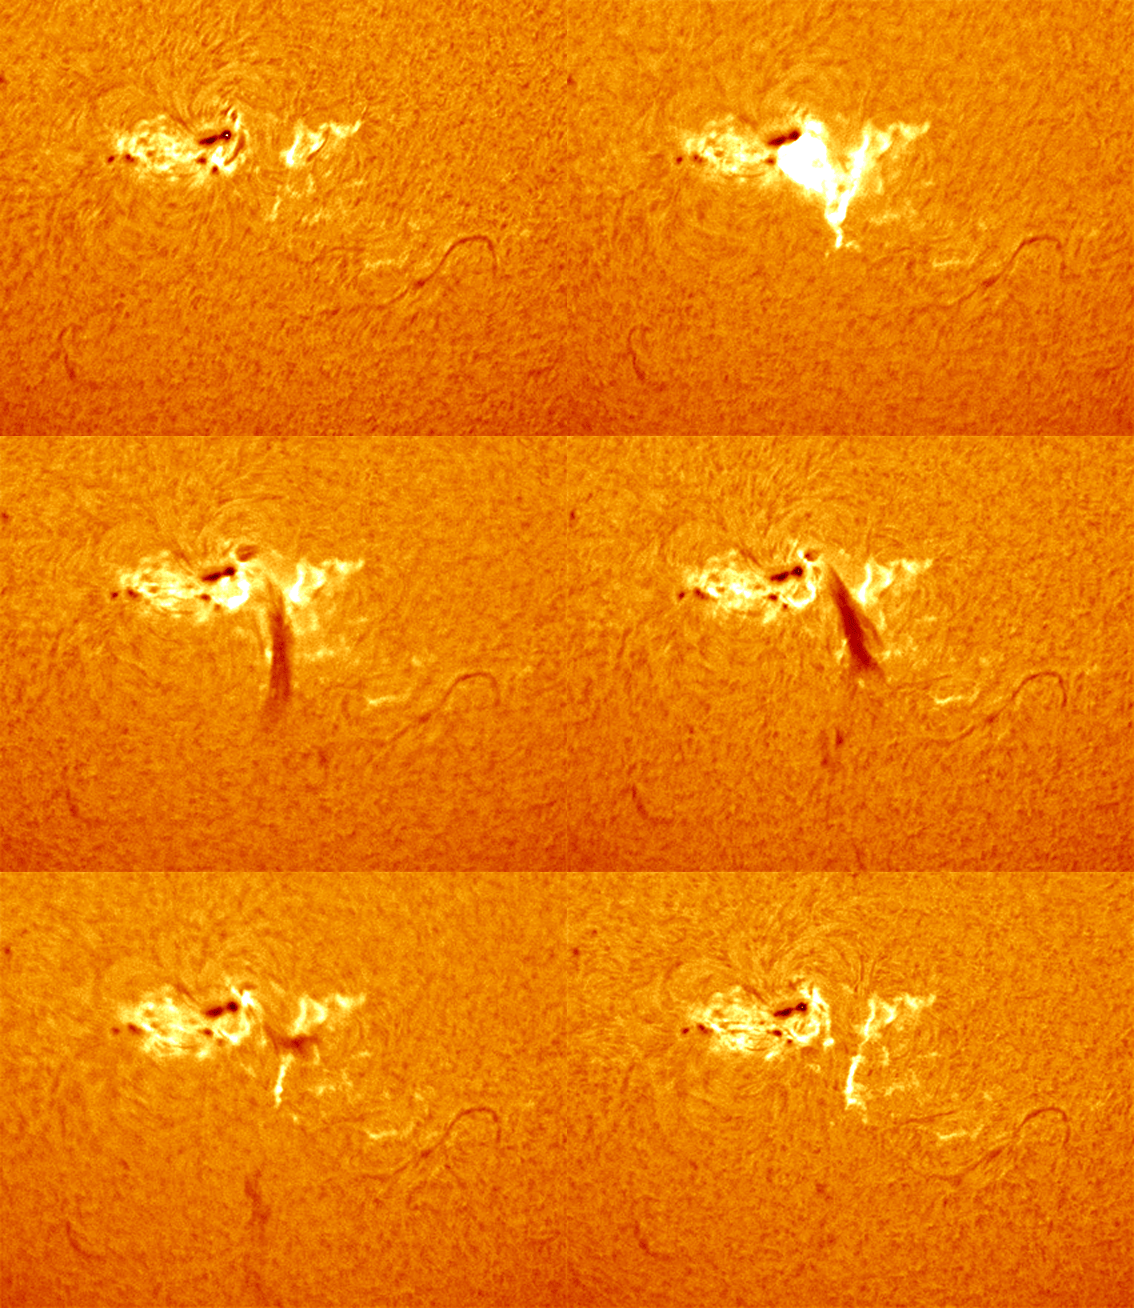

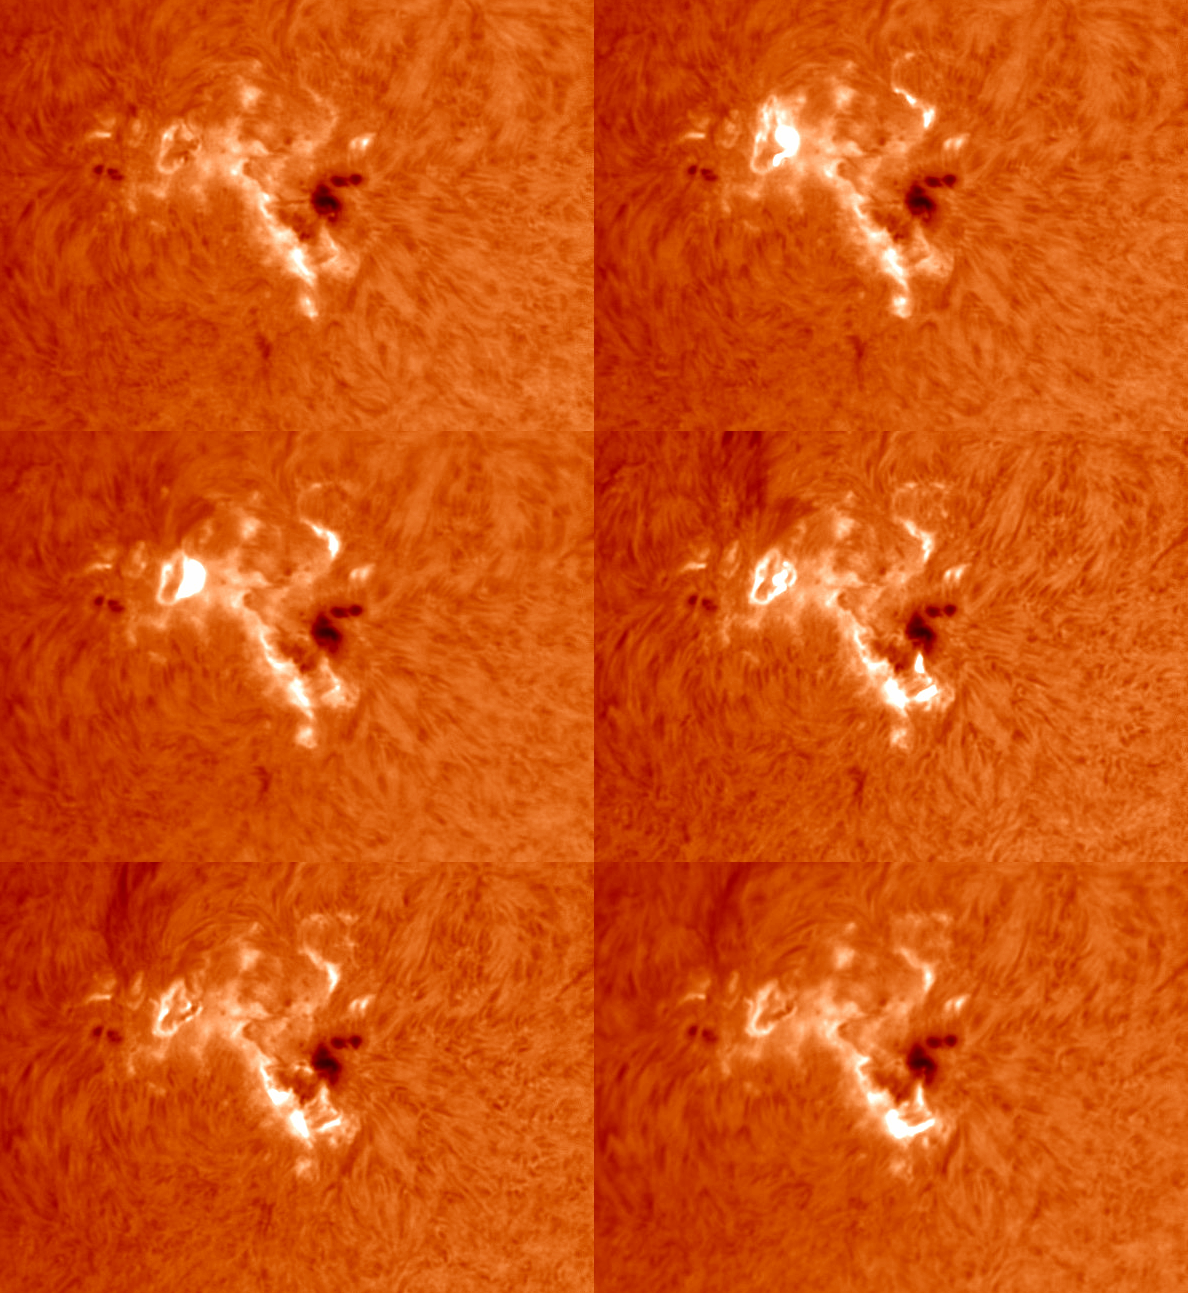


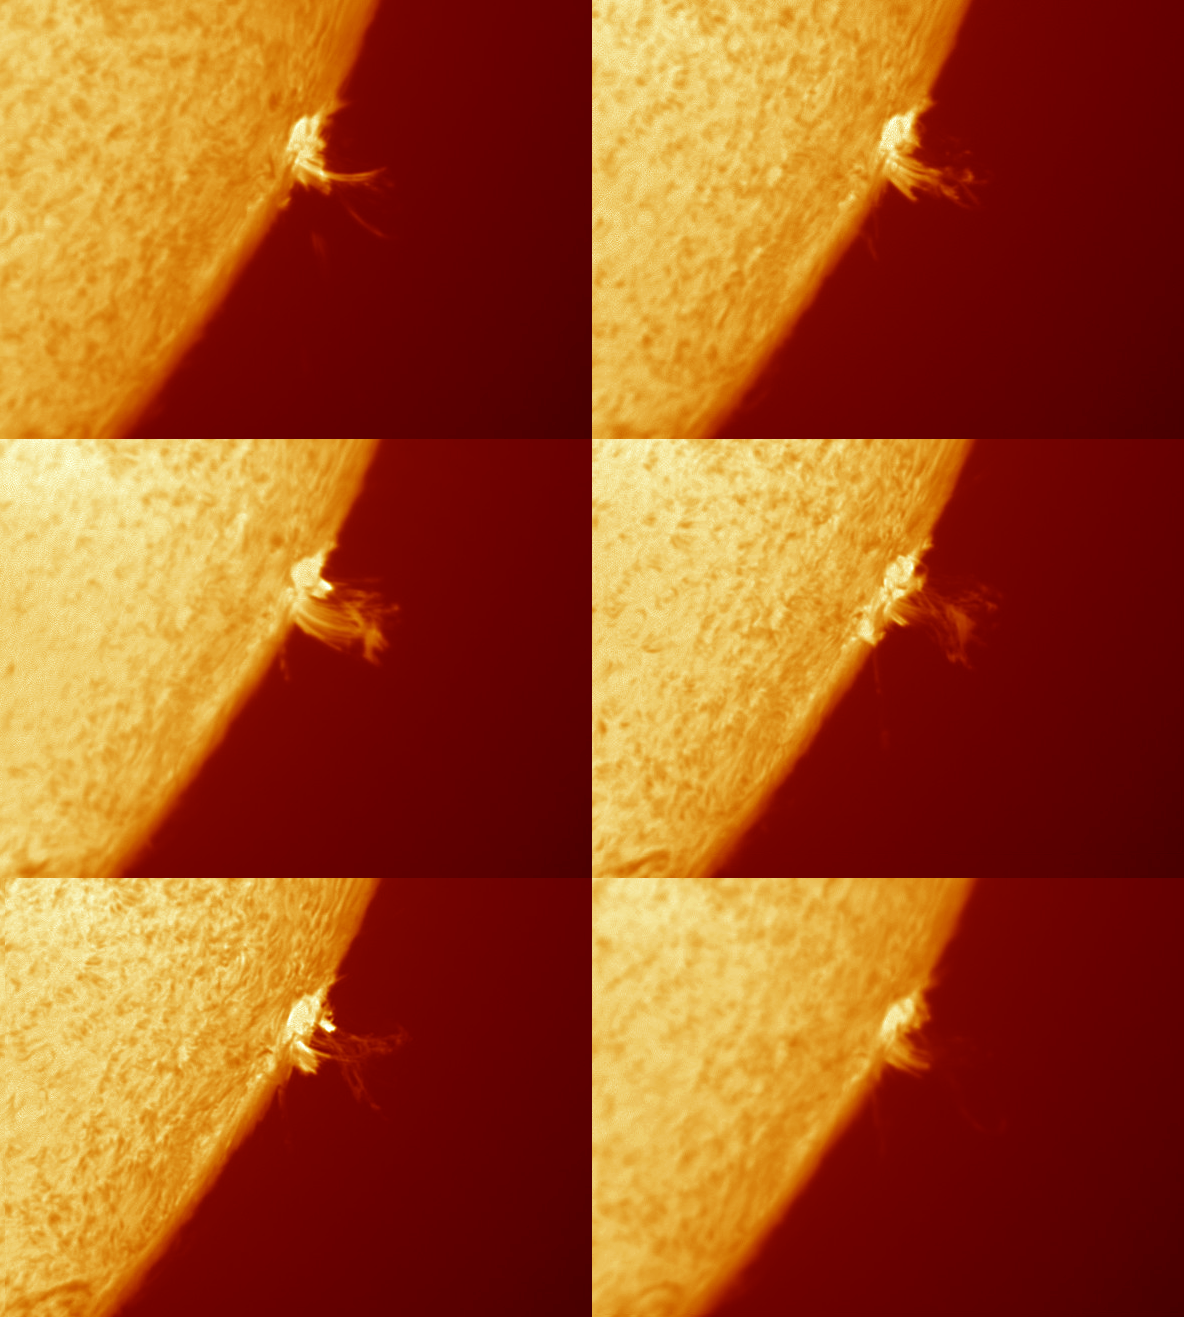
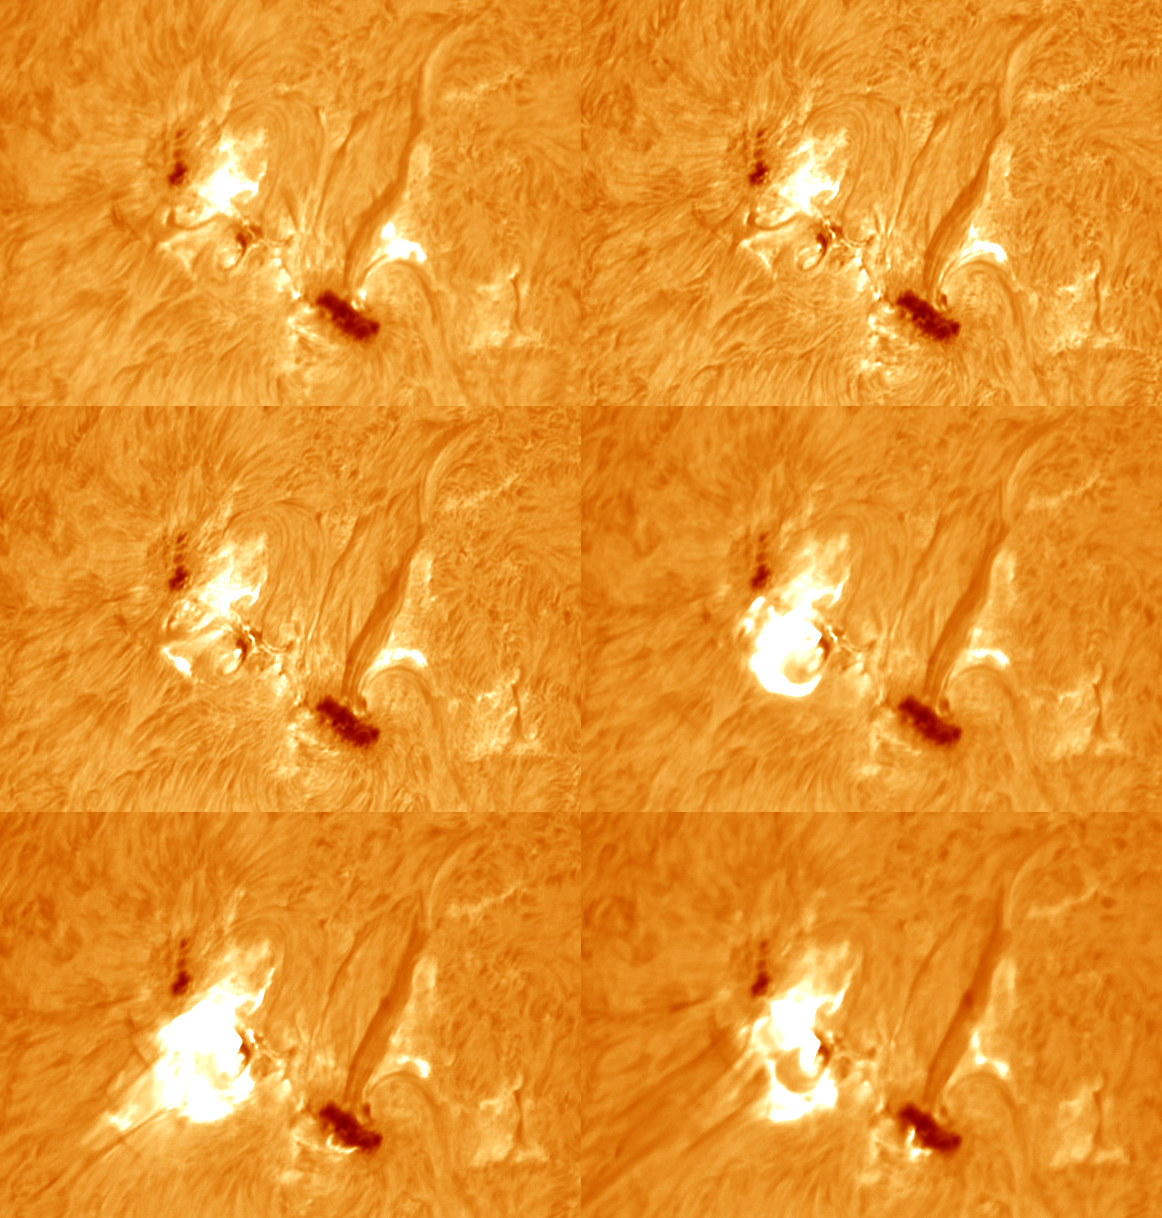
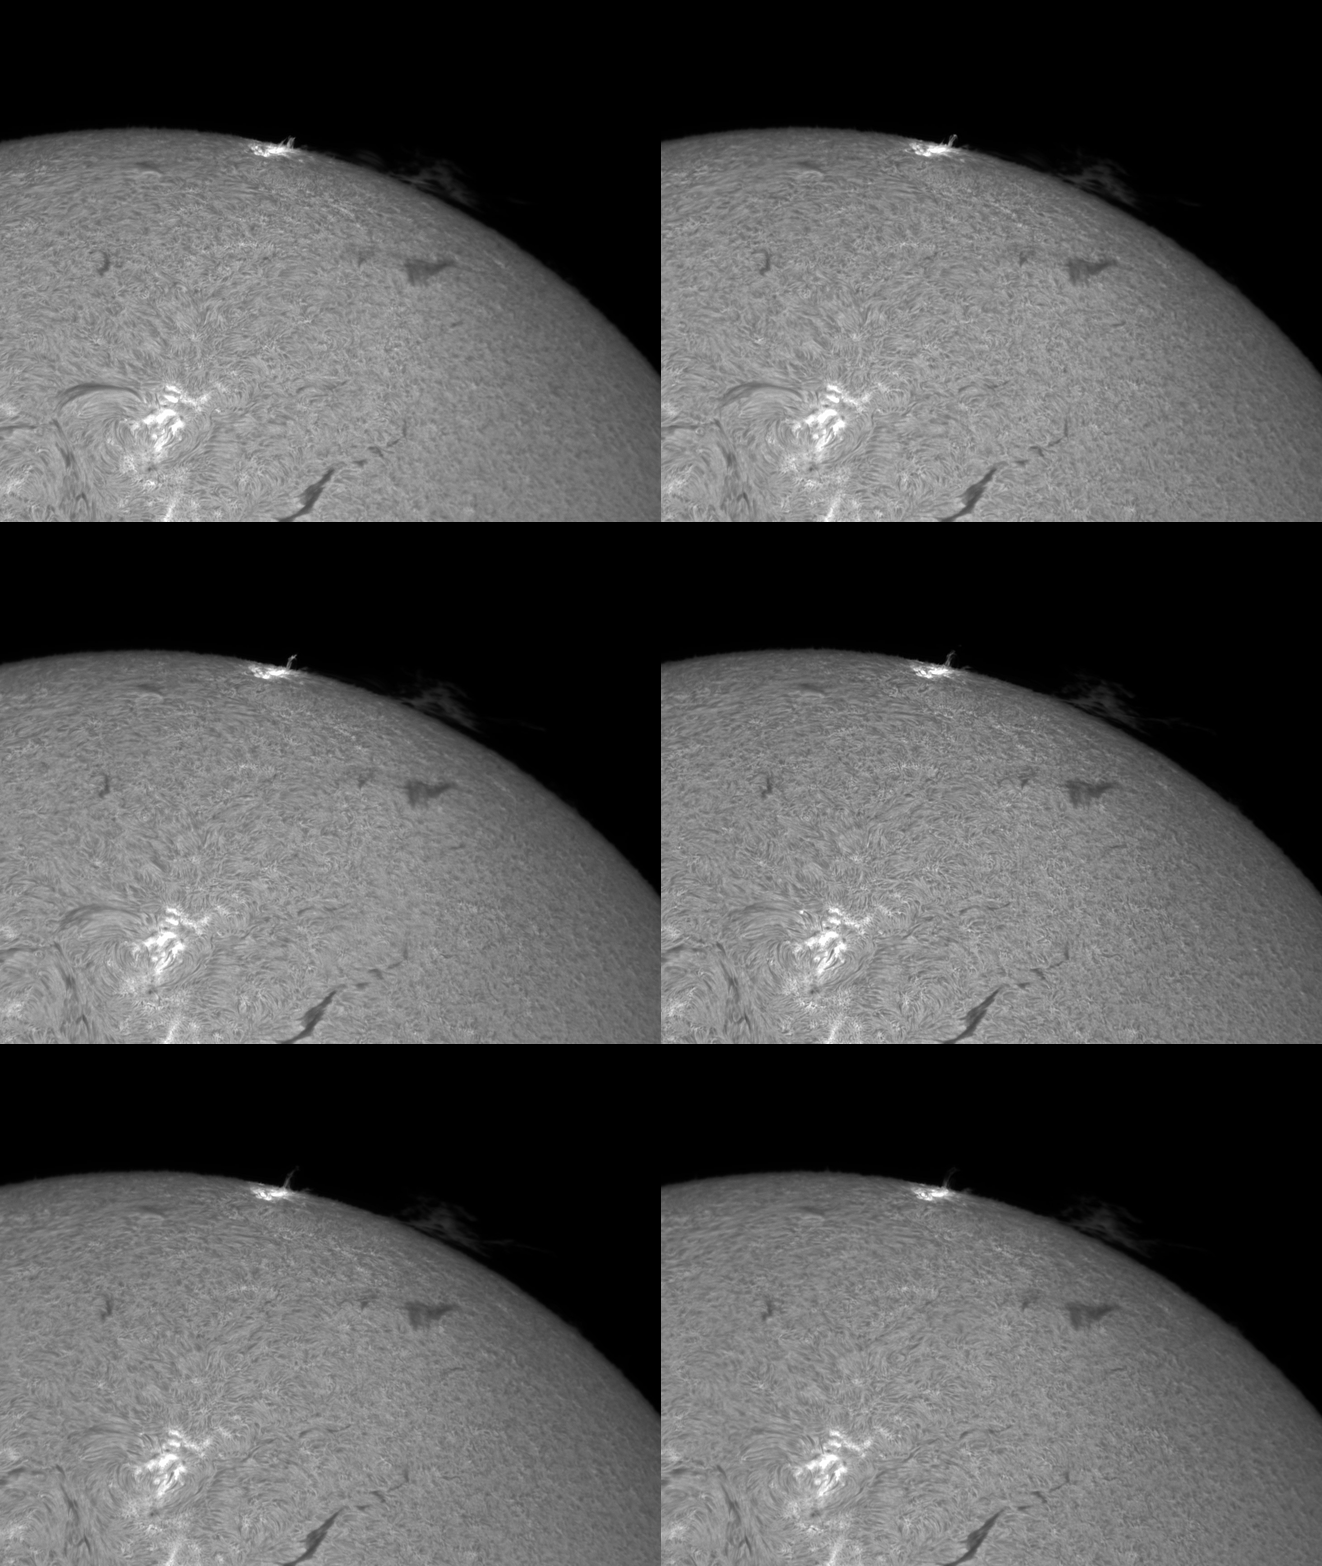
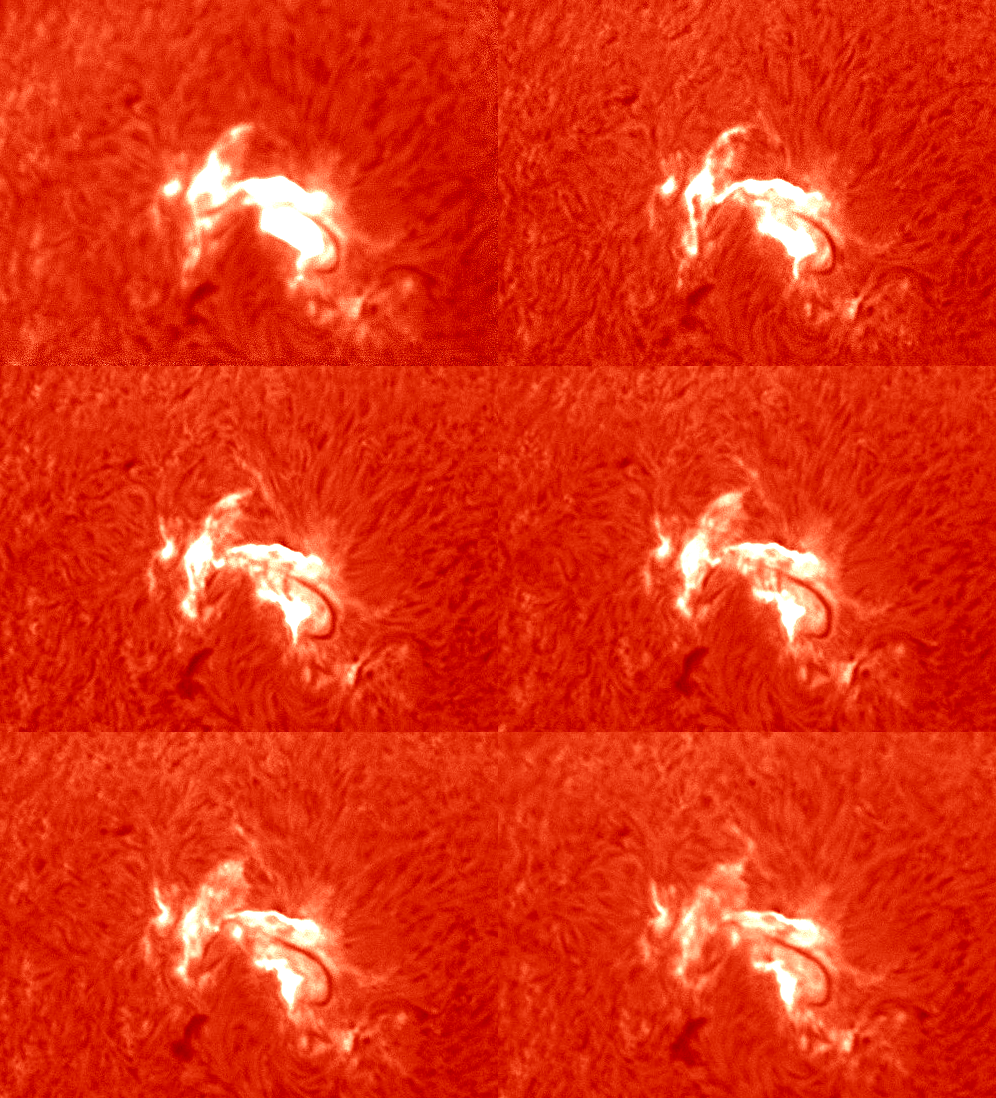
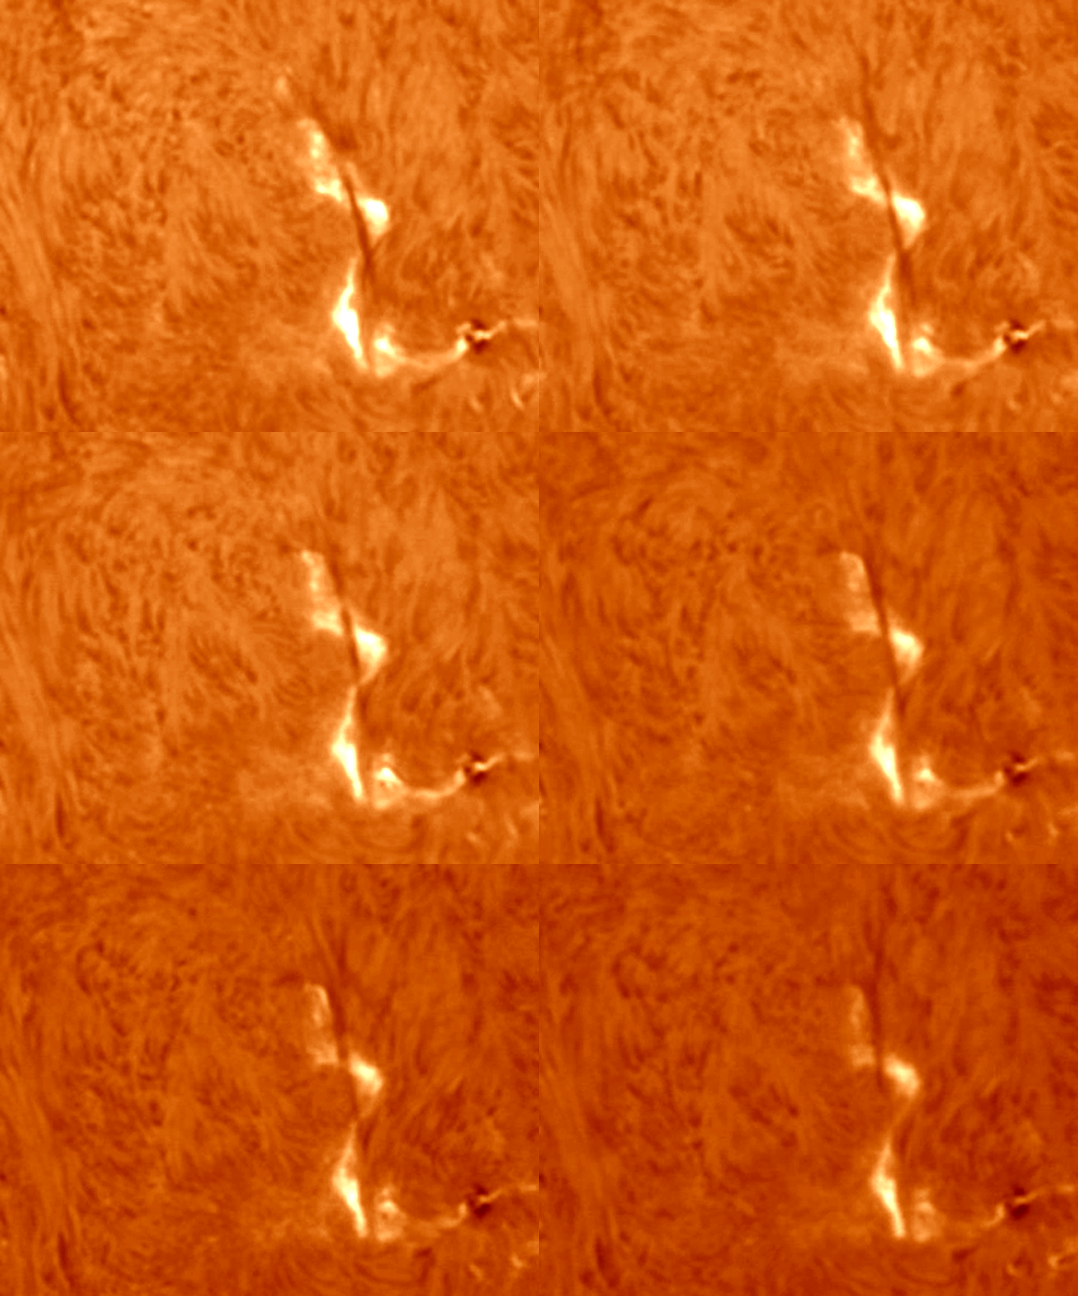

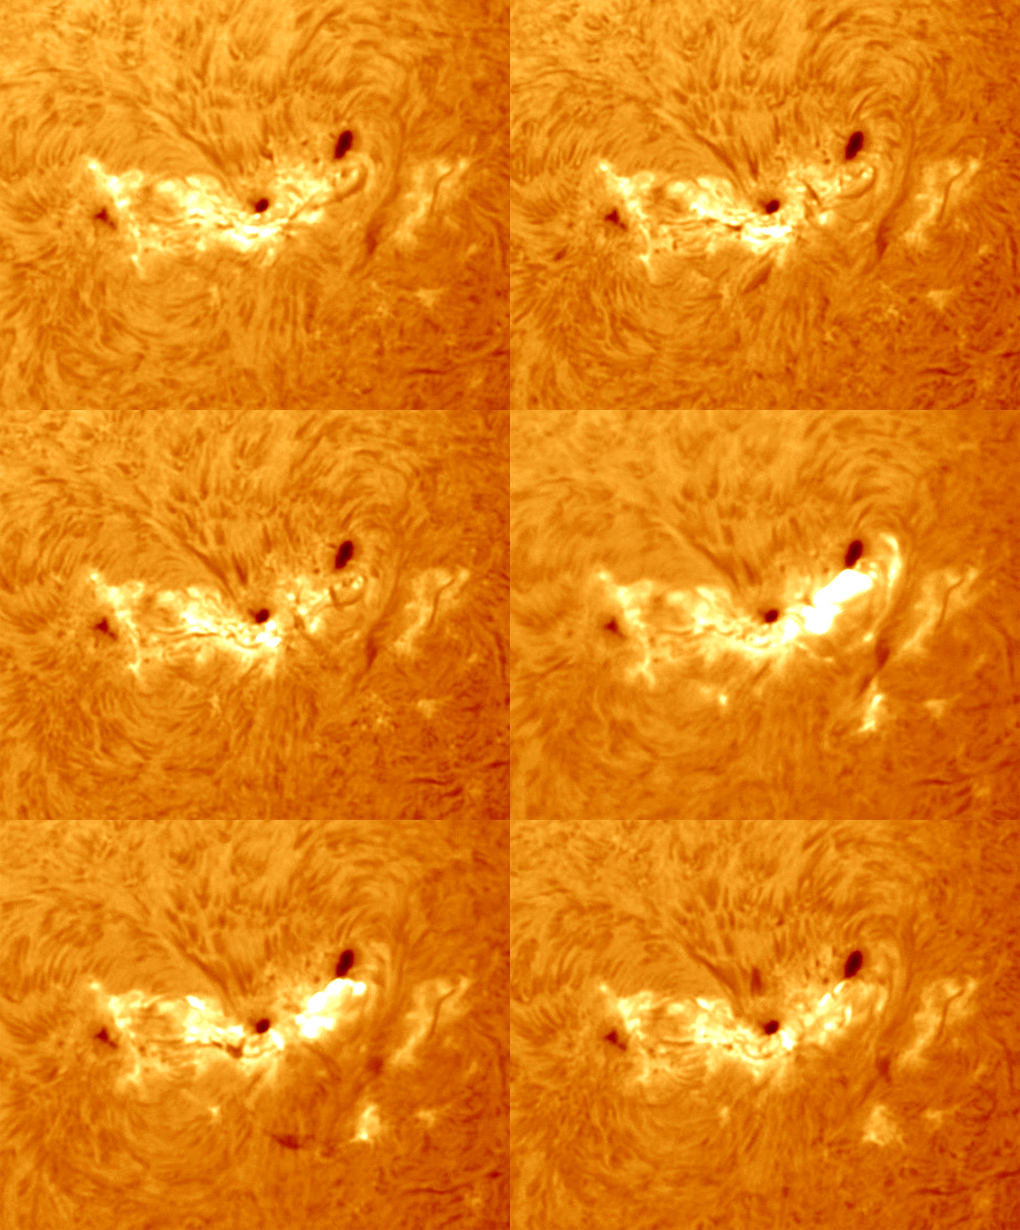
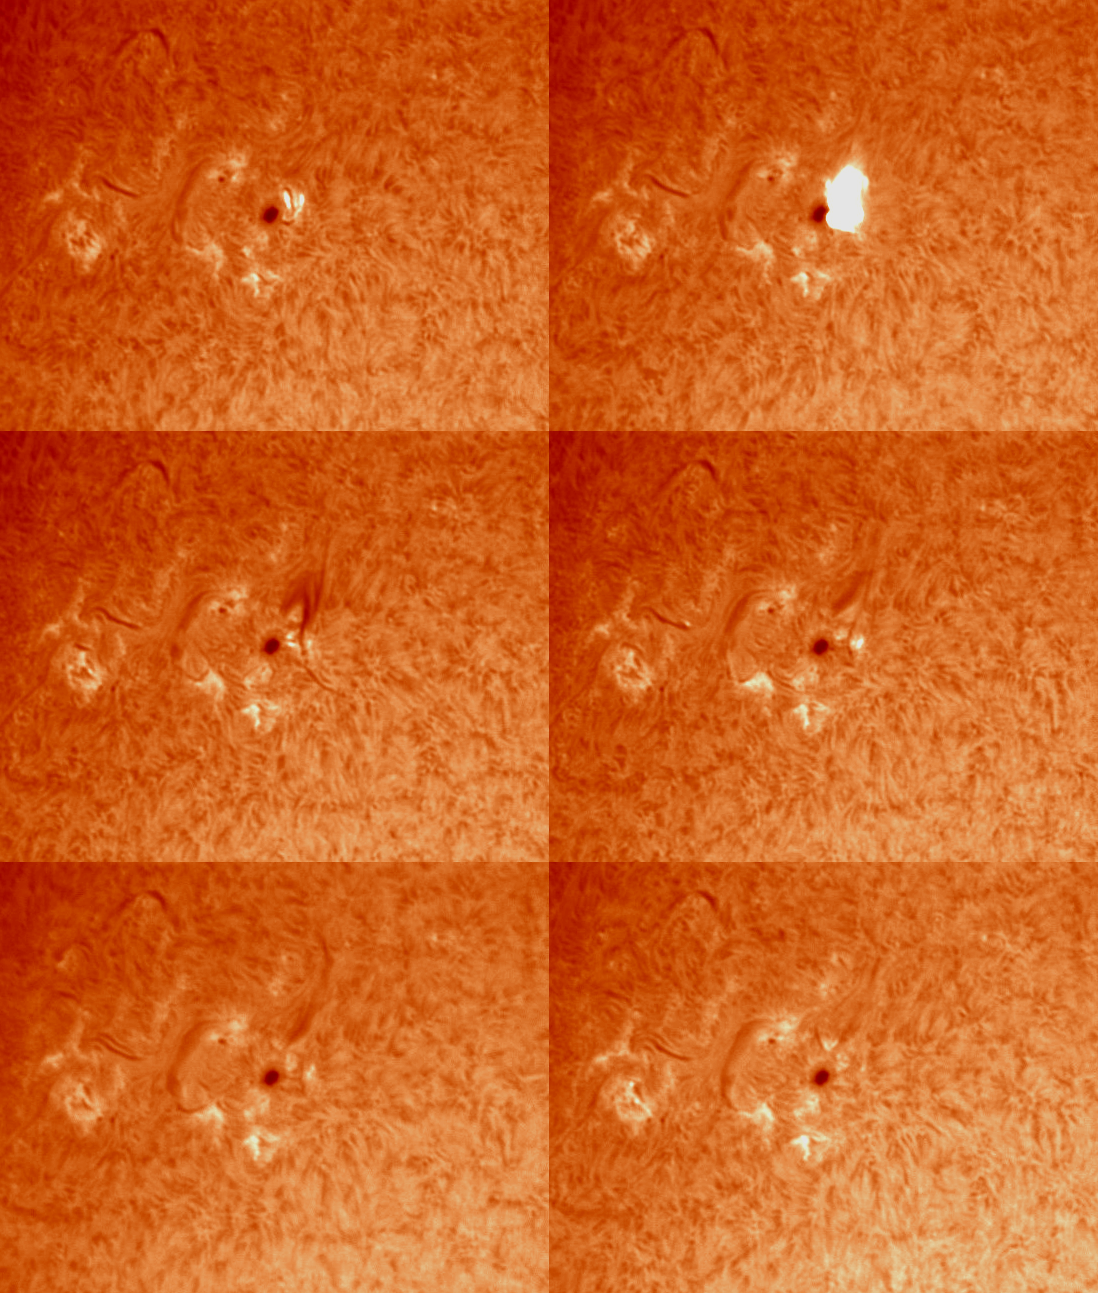
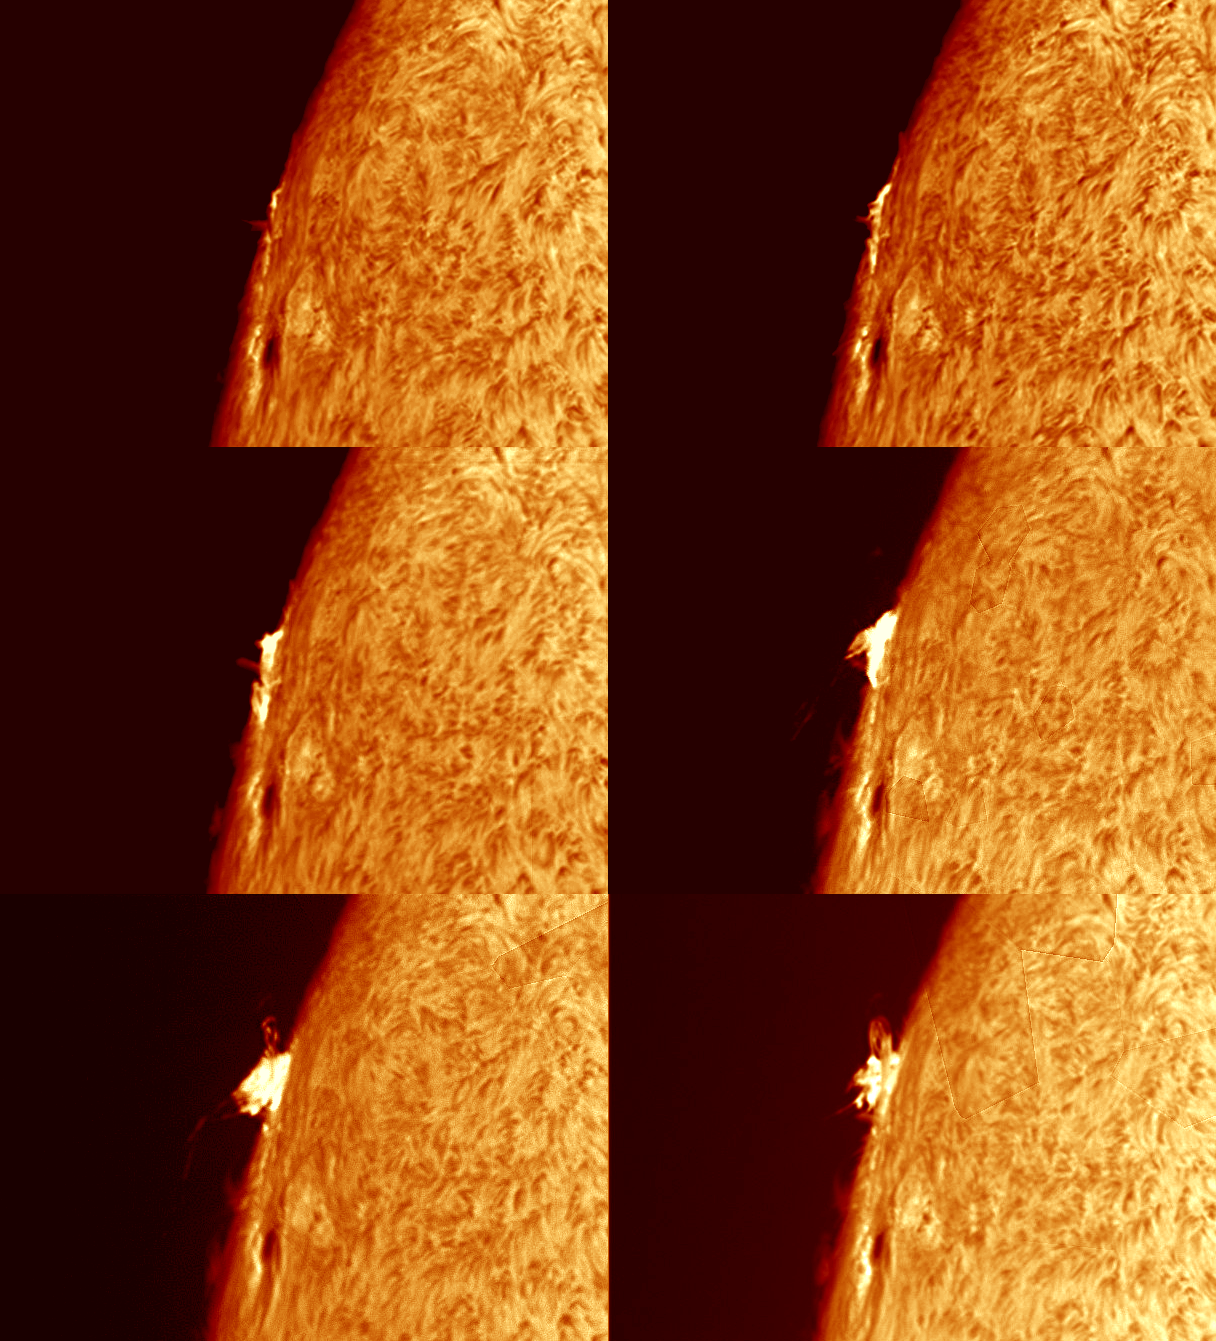

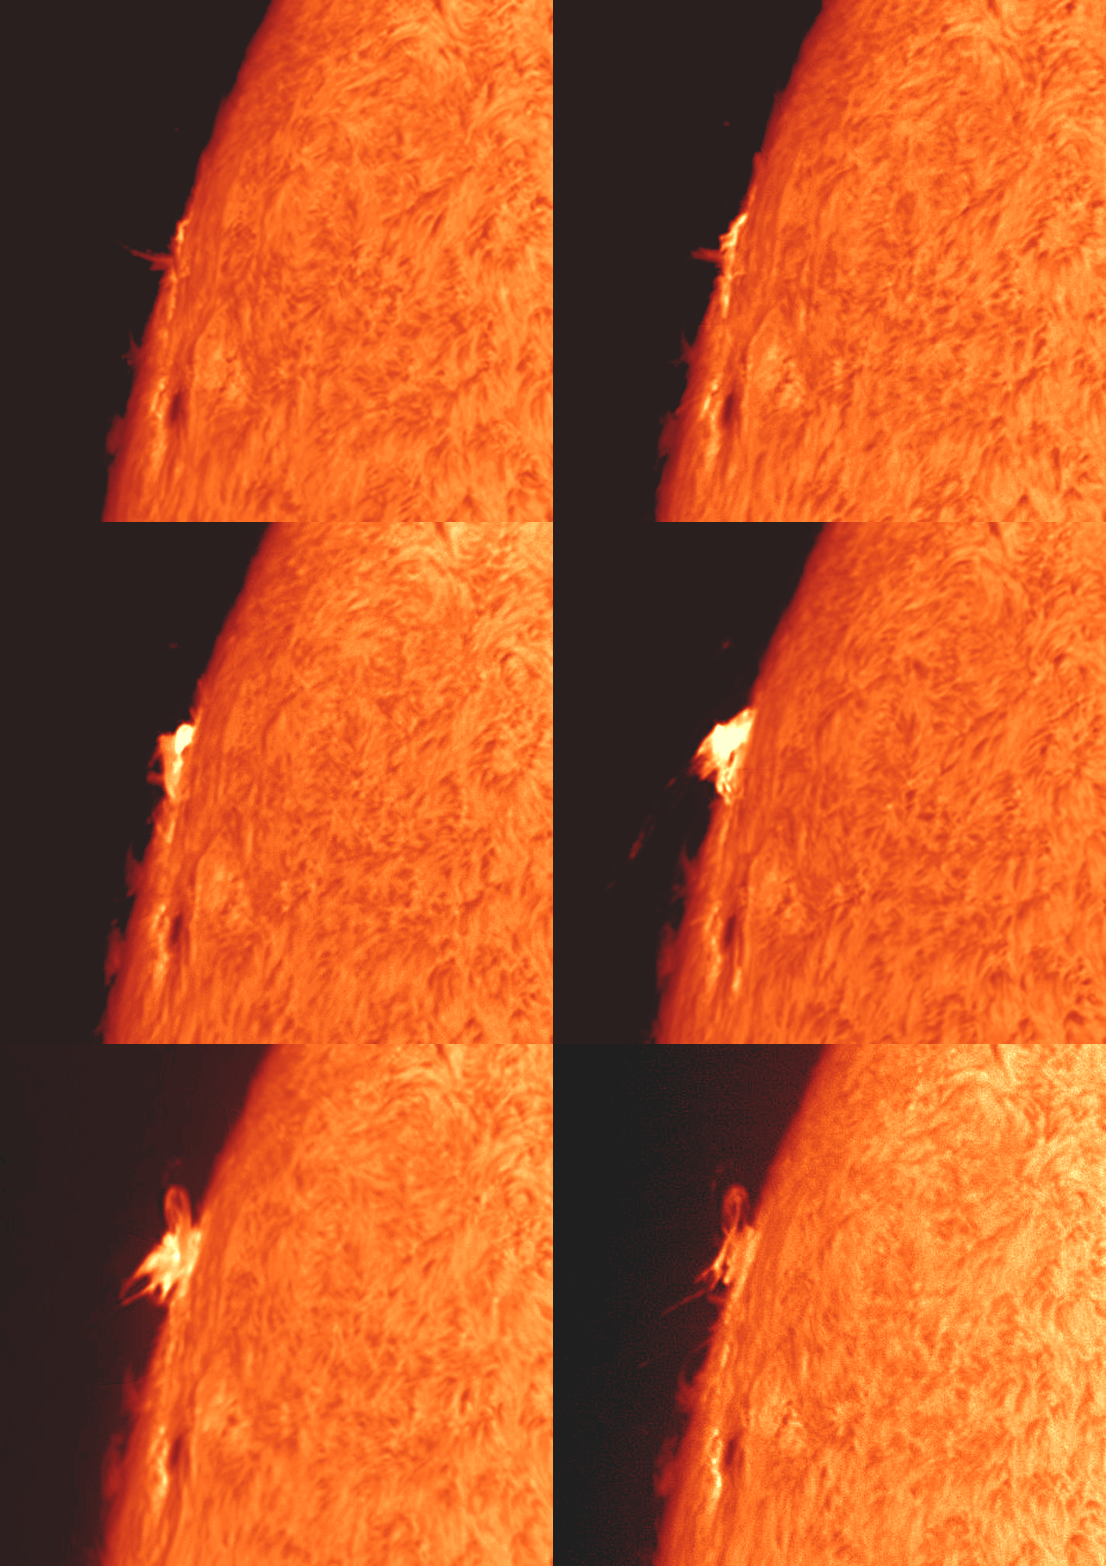
M2.0 Moreton wave
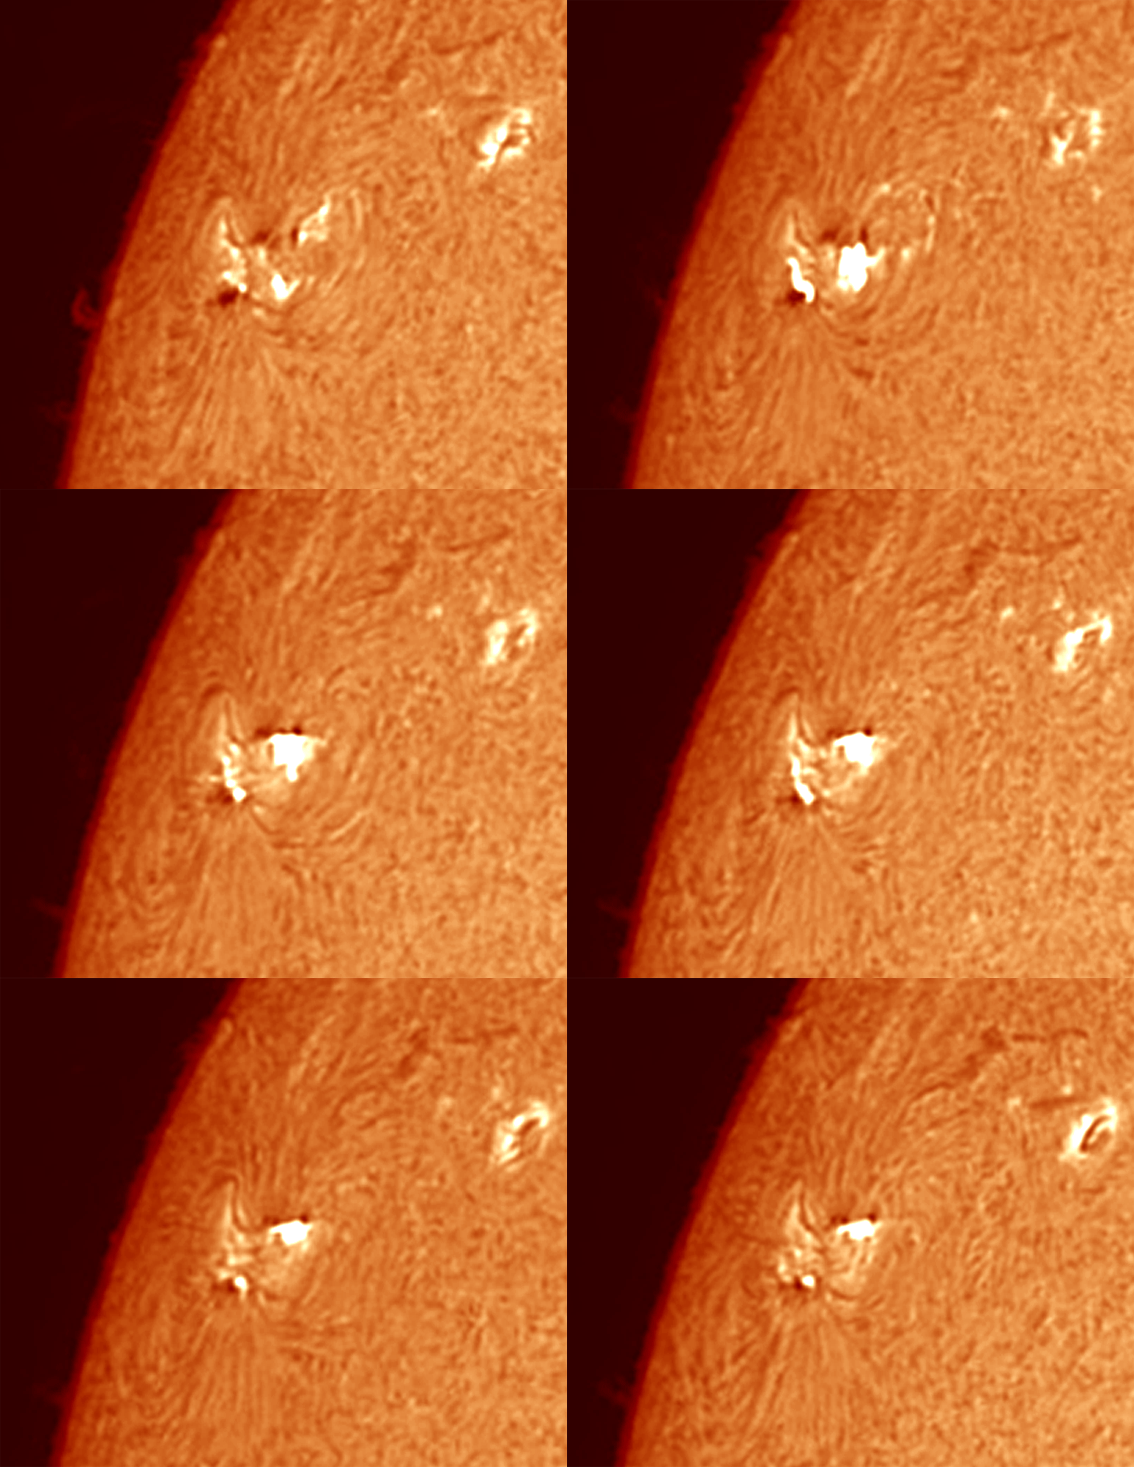
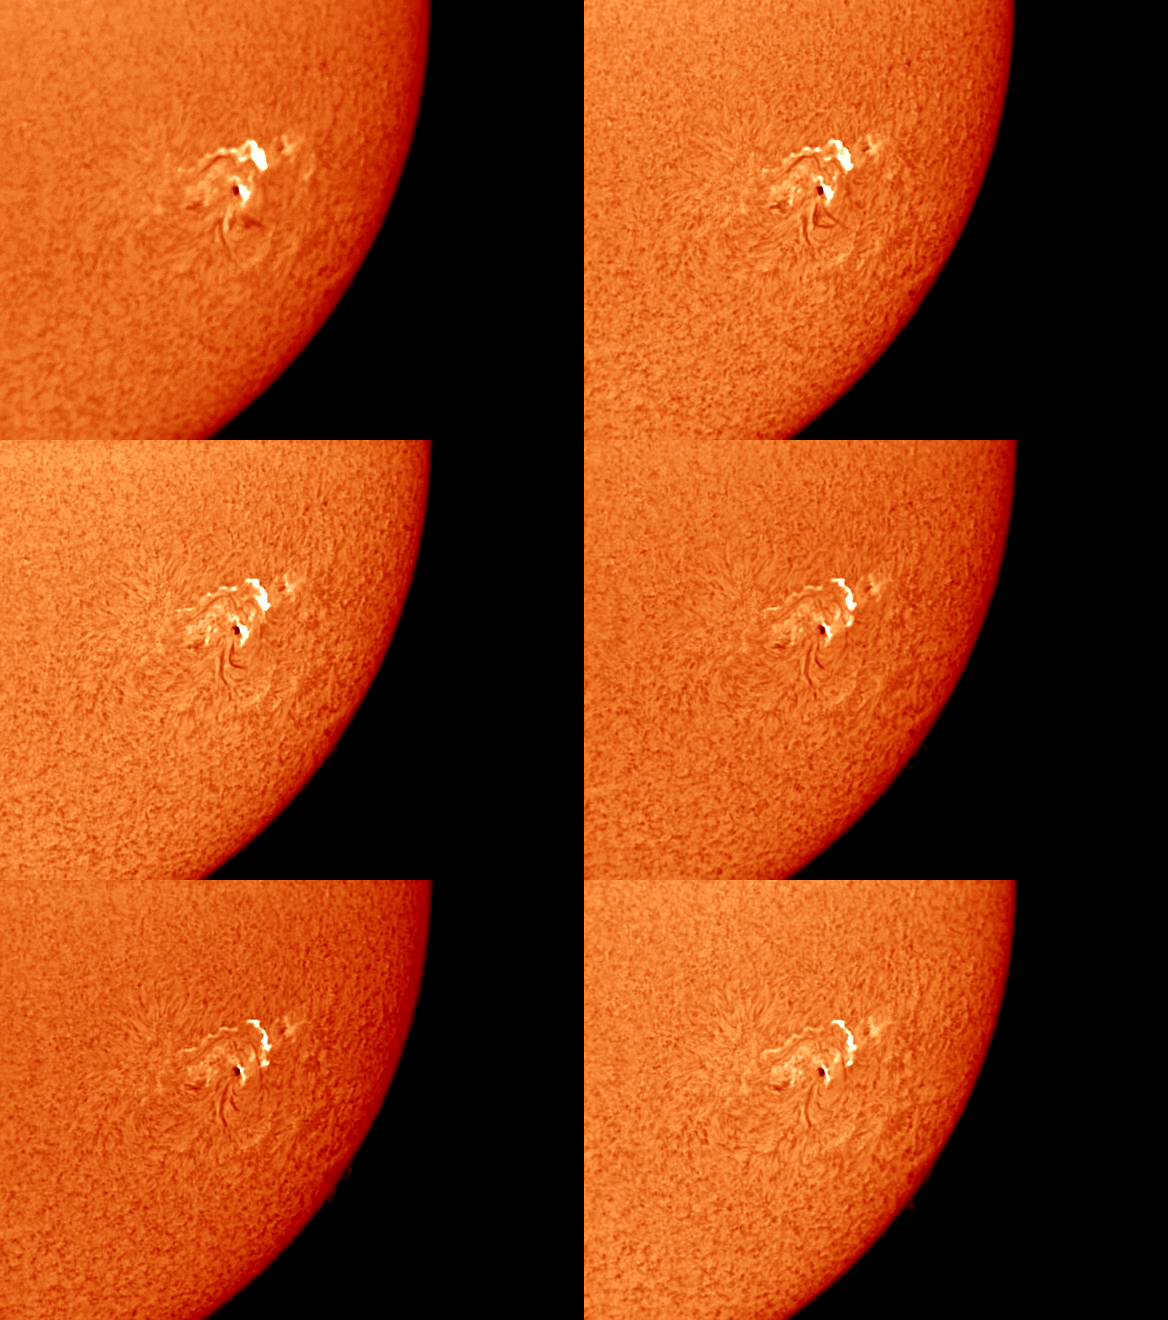

M1.9 Post flare loops
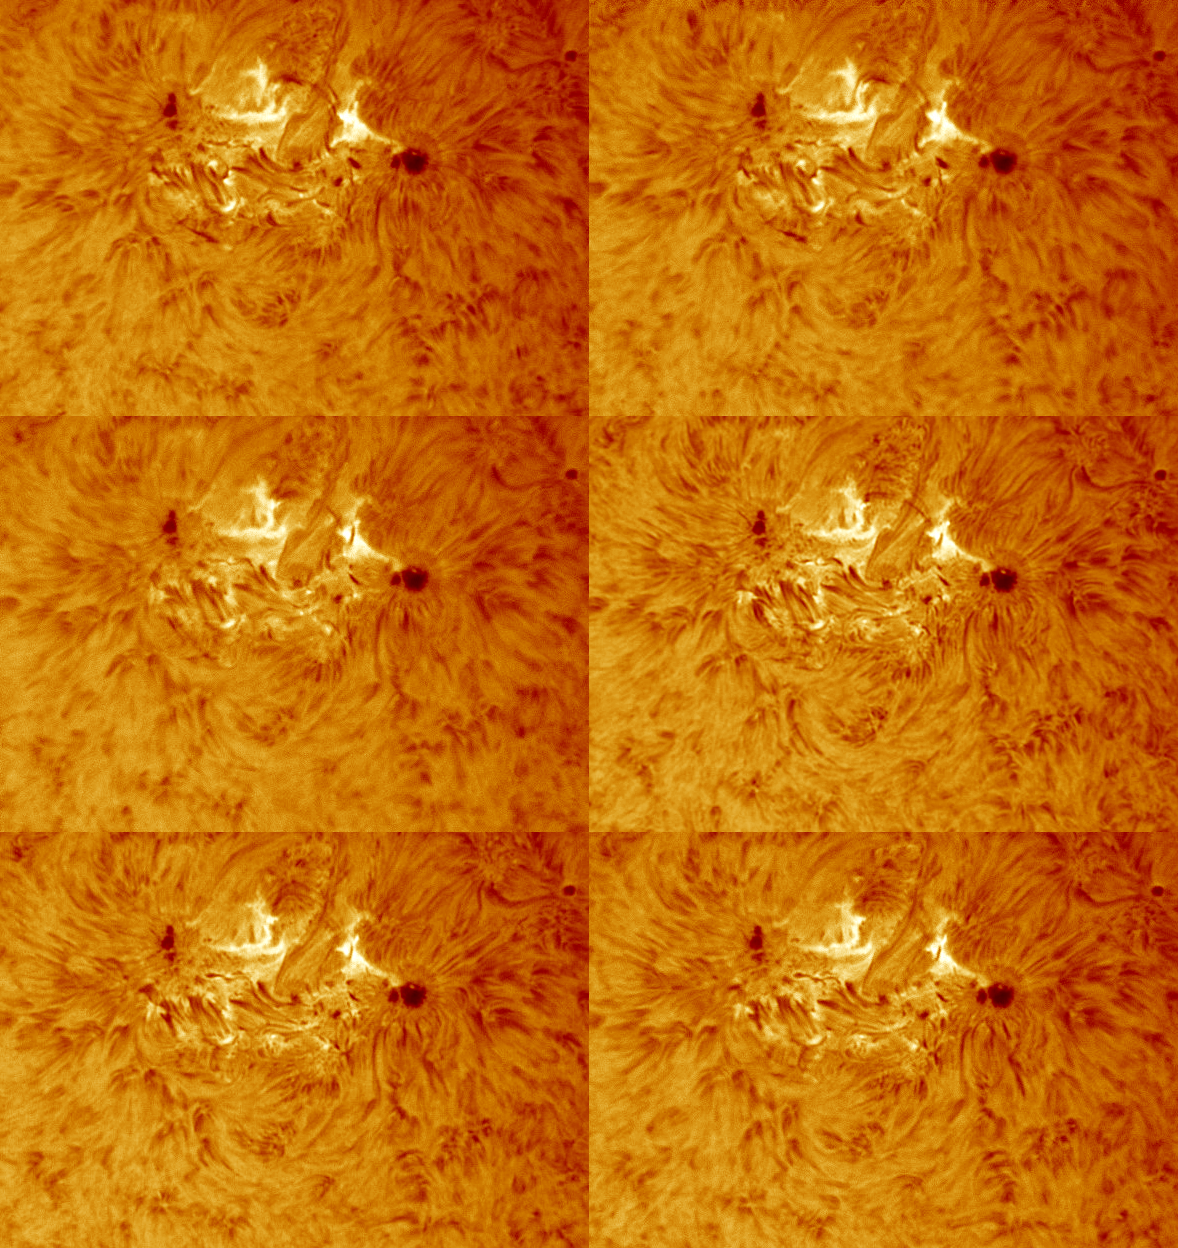


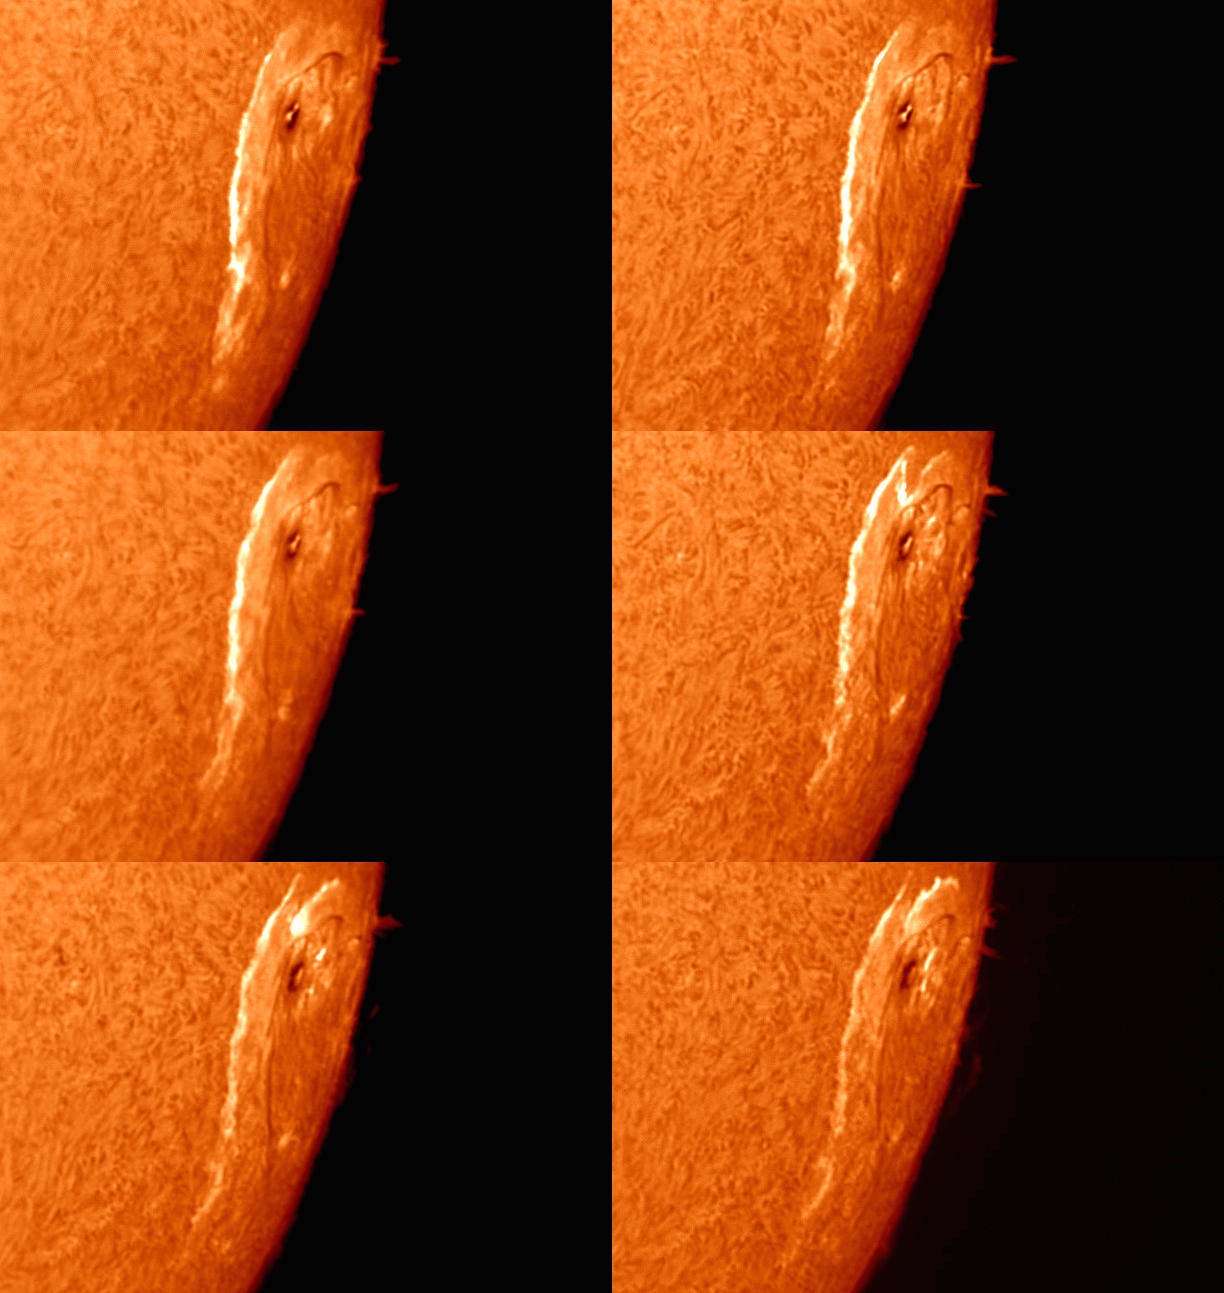


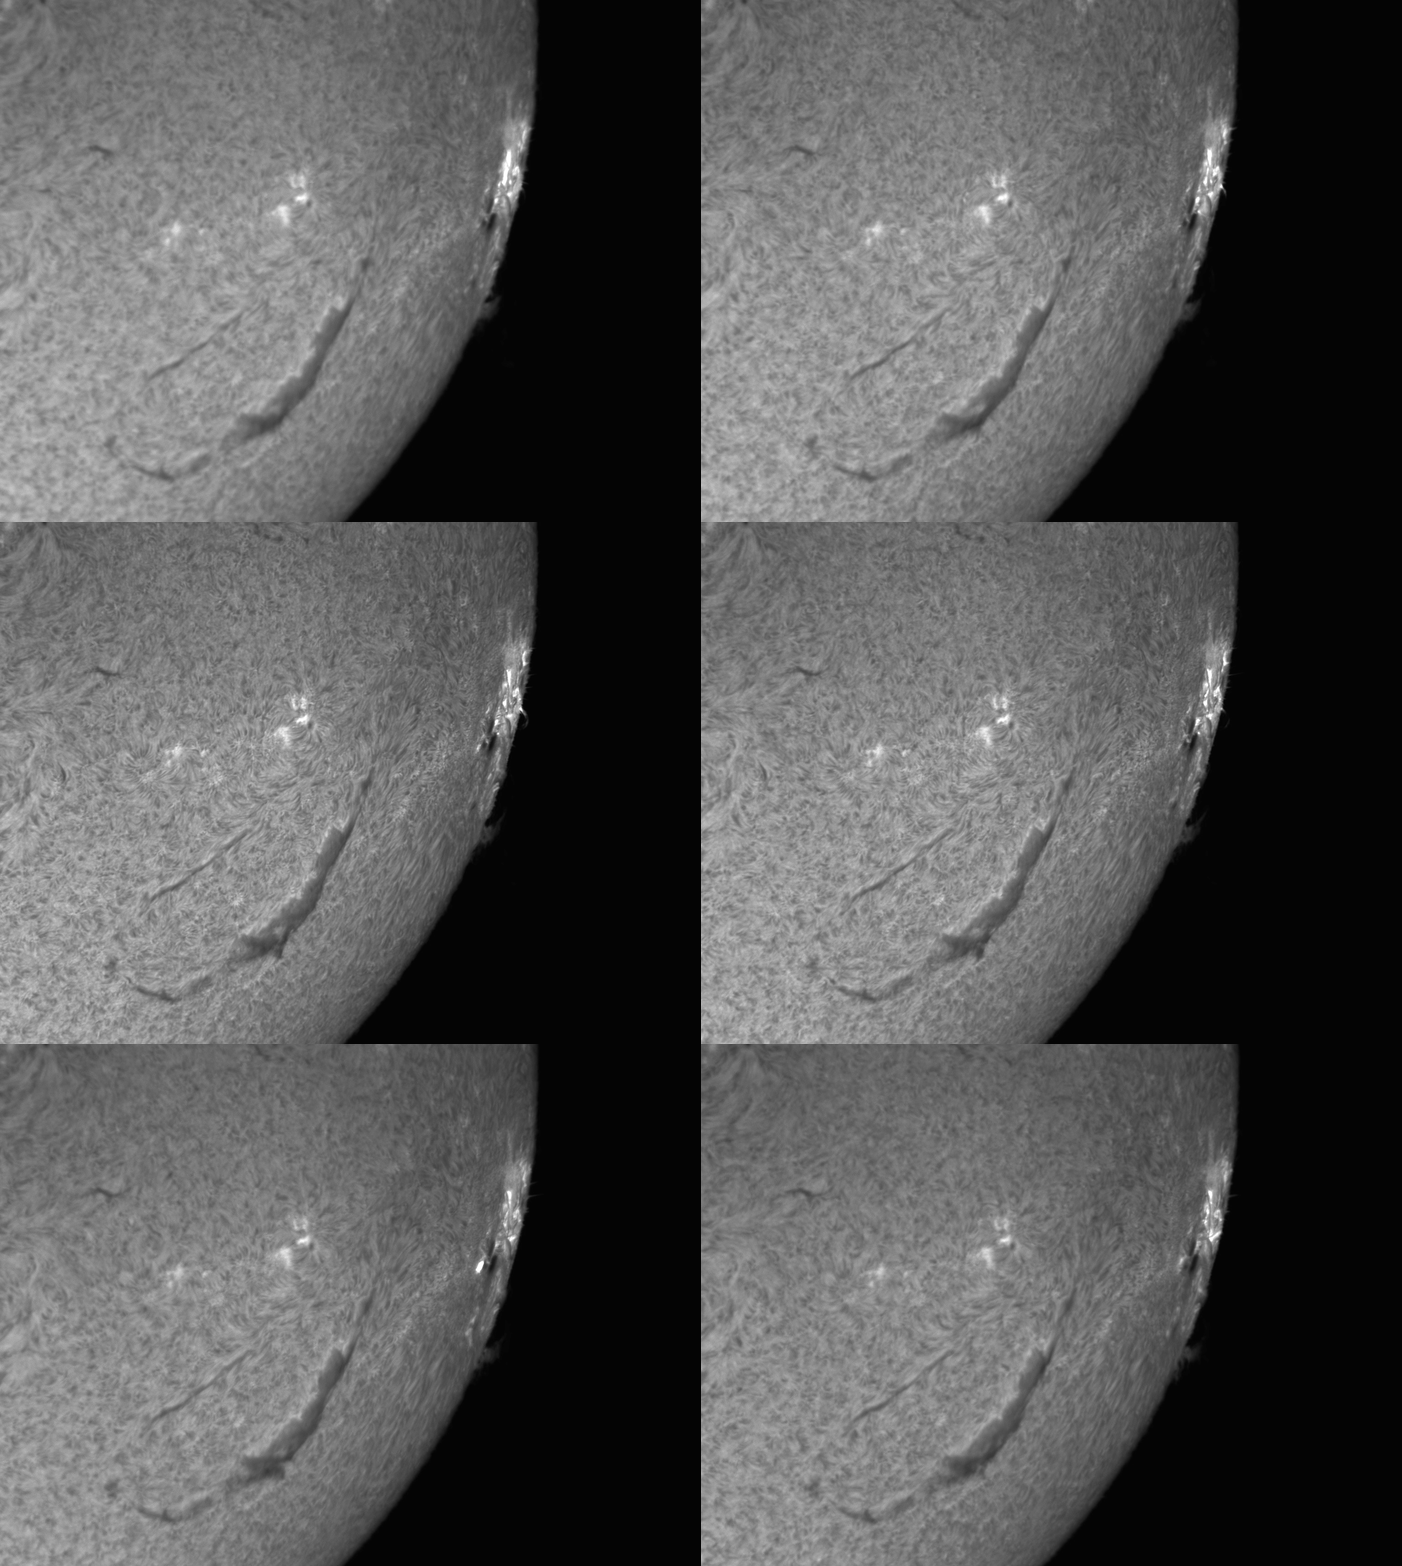
M1.3 Post flare loops


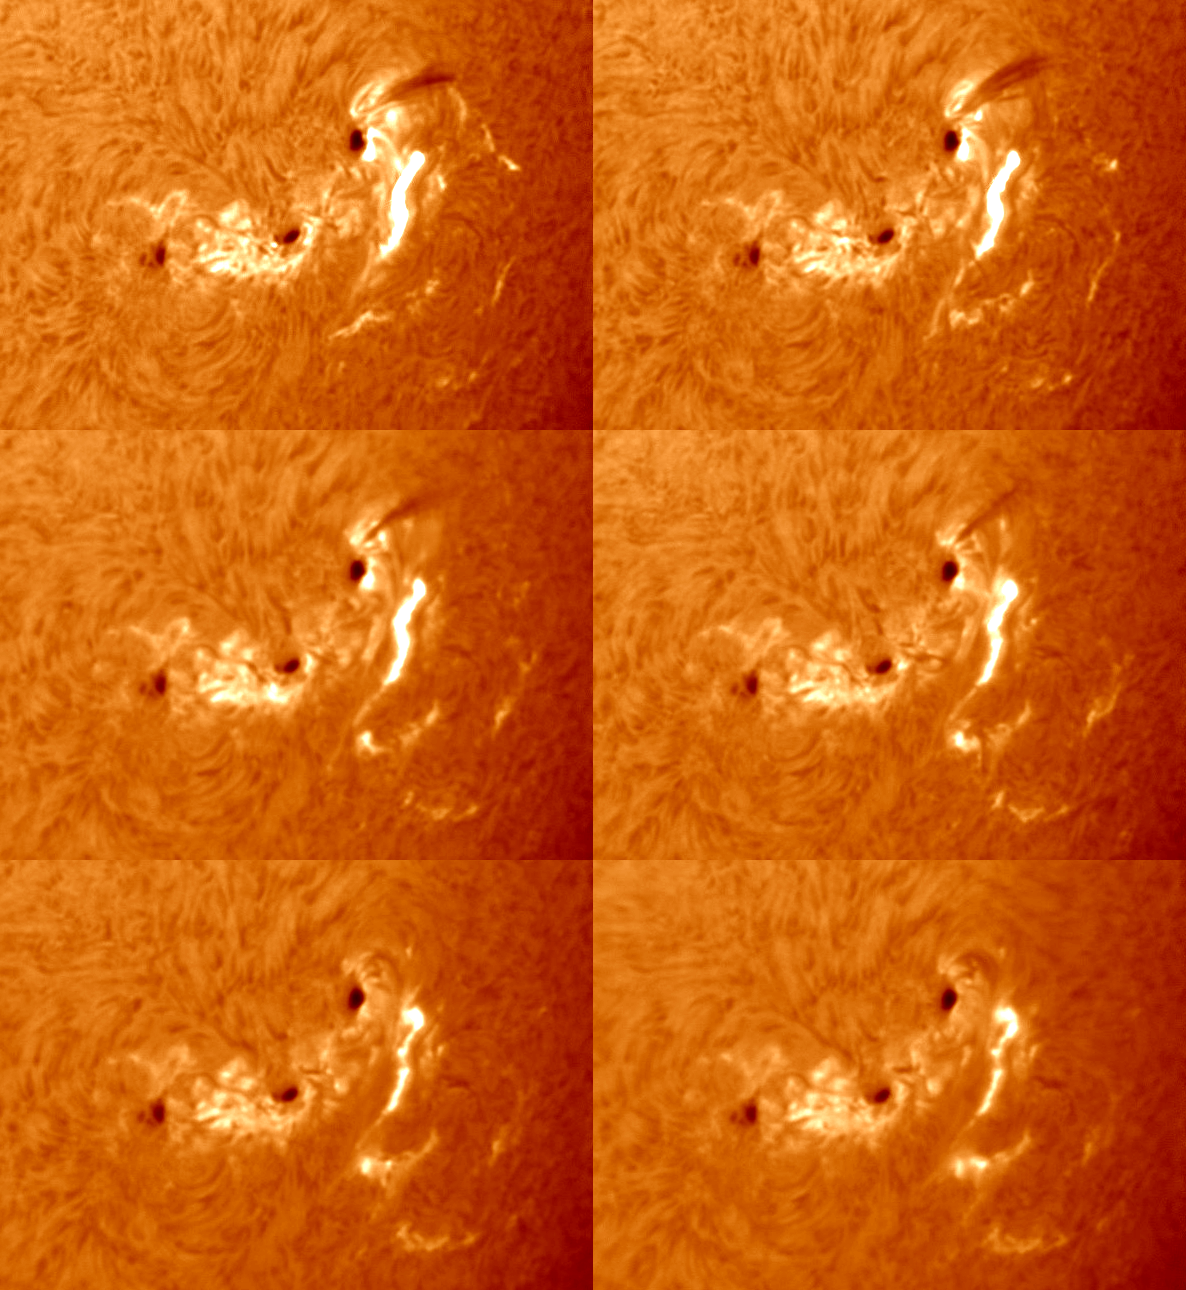
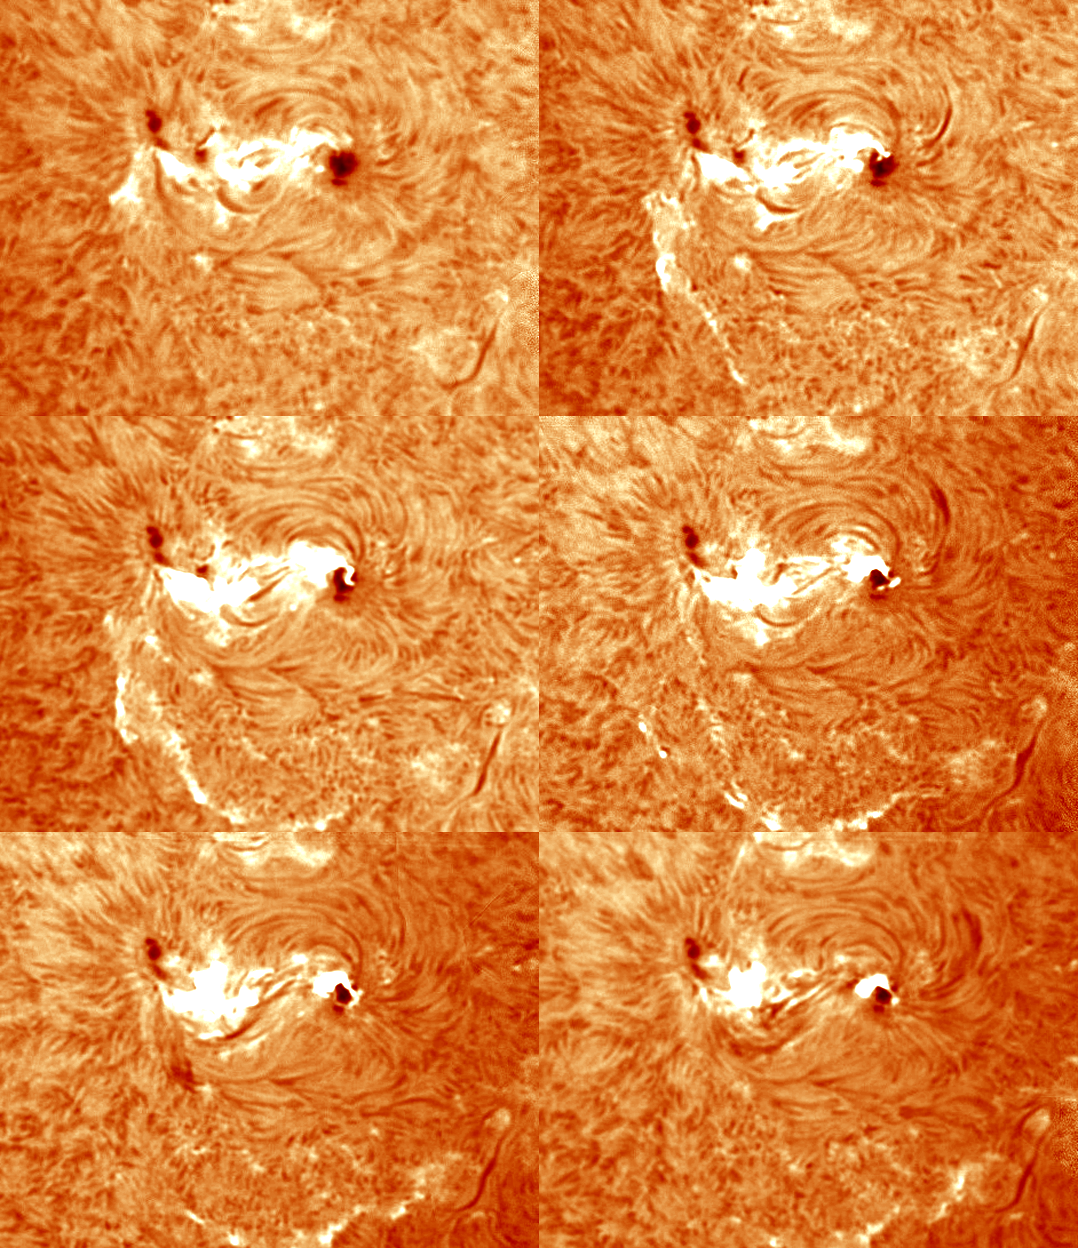
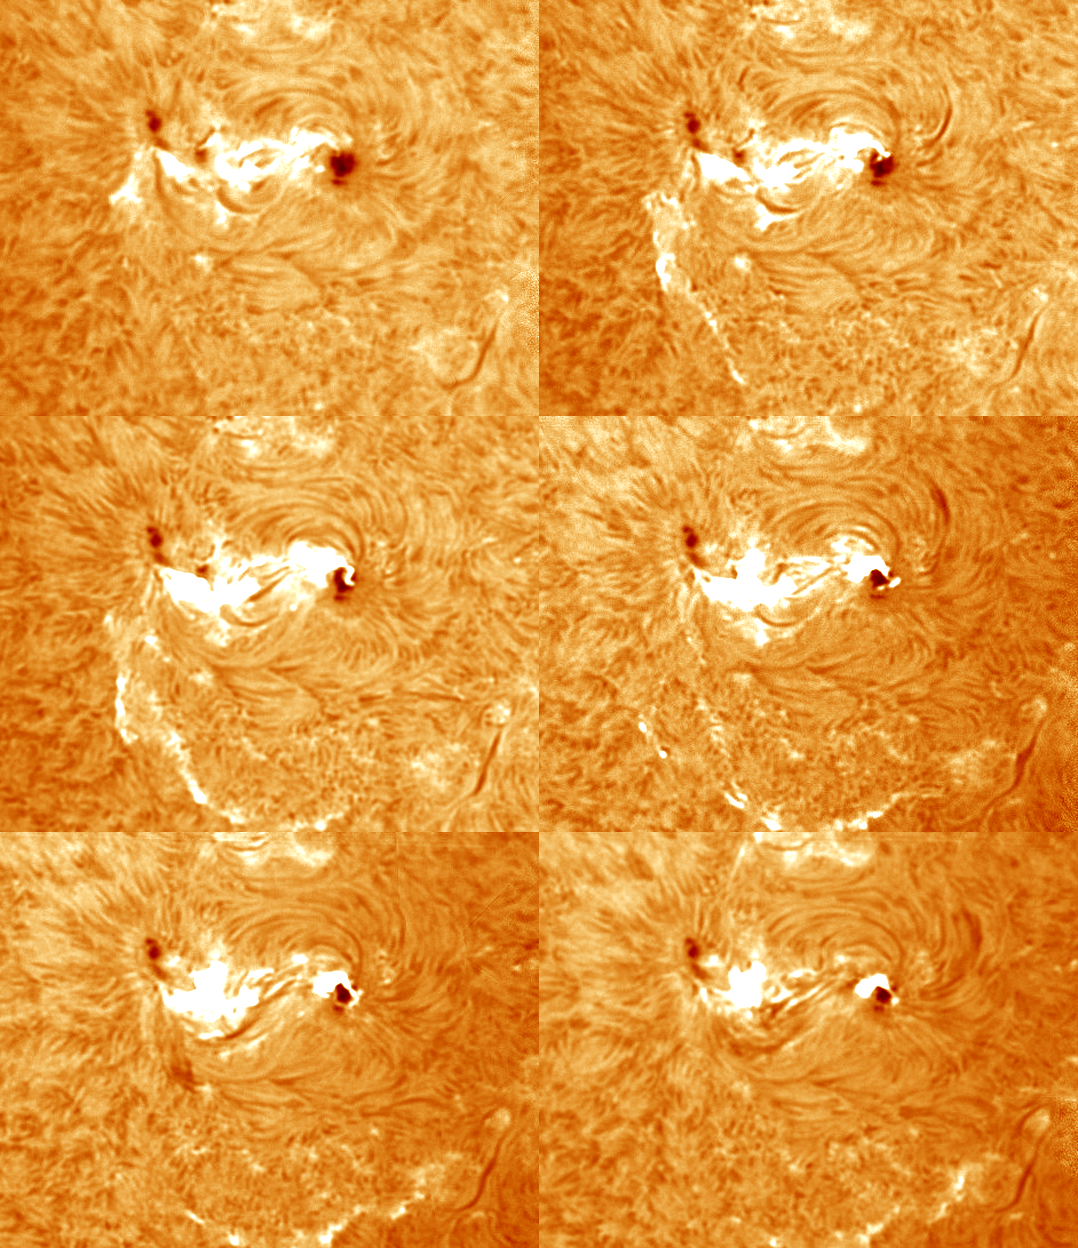
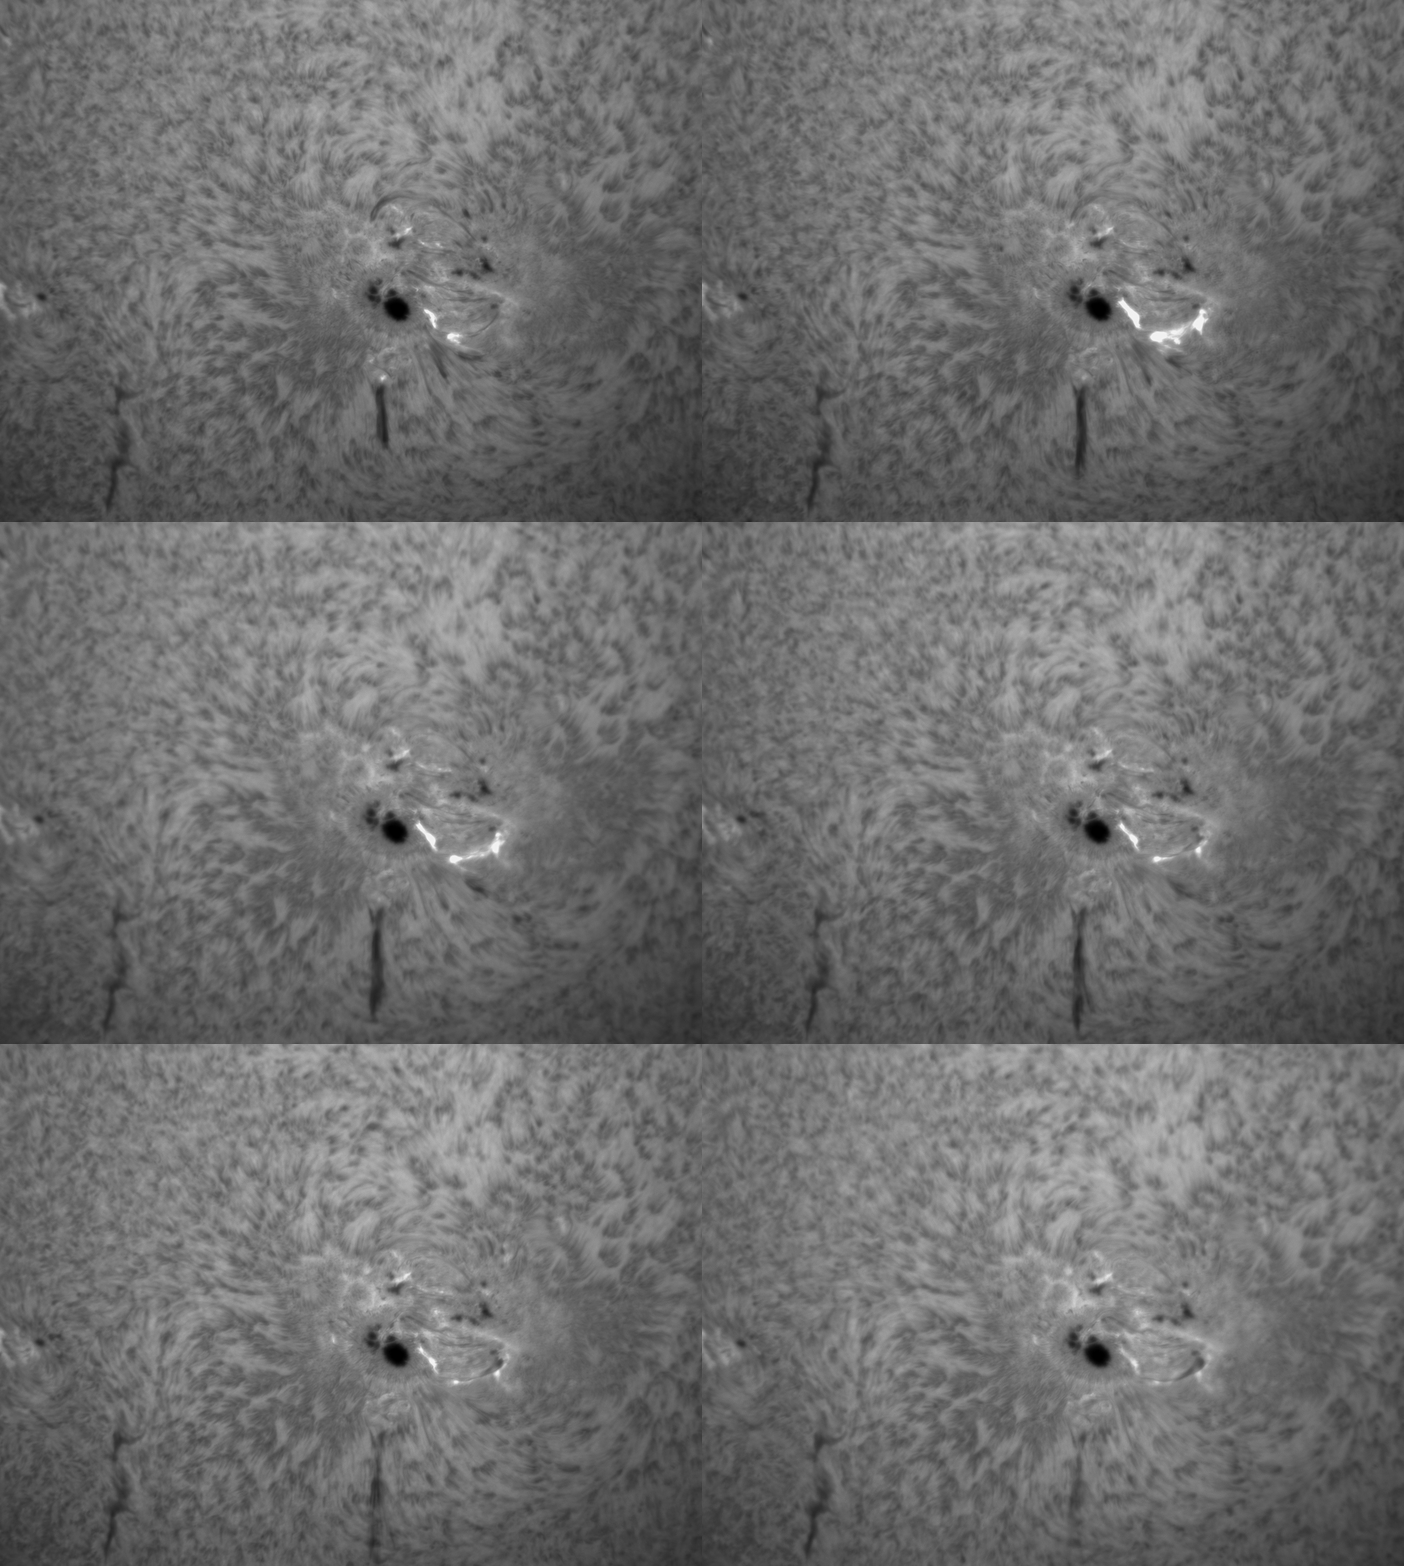
M1.1 post flare loops

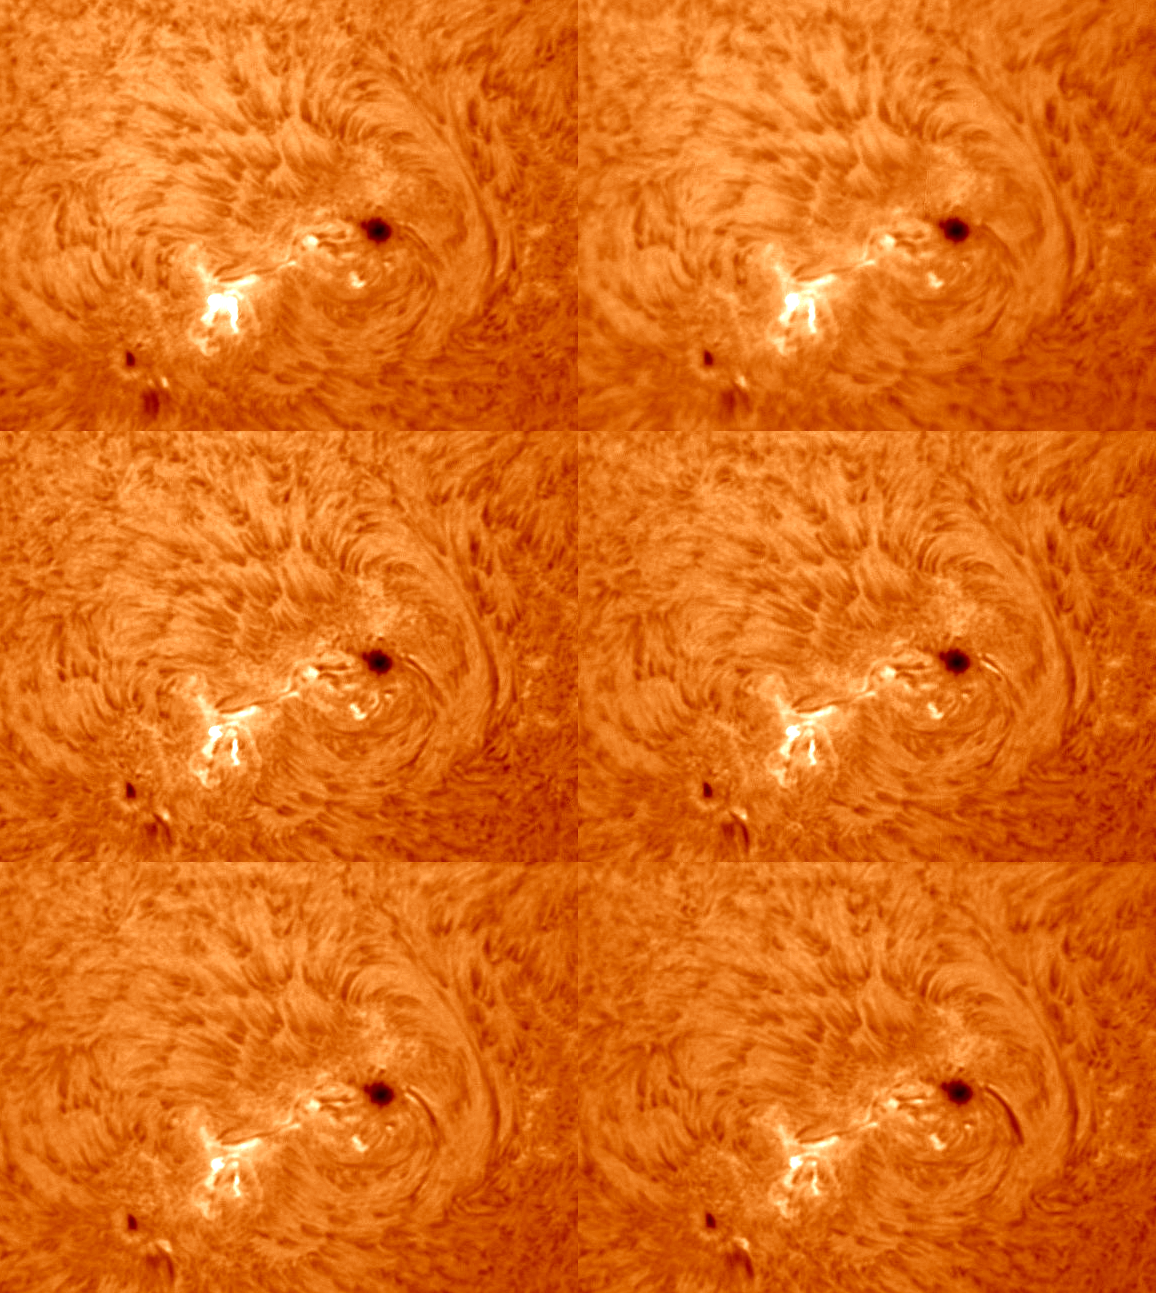


C8.4 GONG

C8.4 GONG
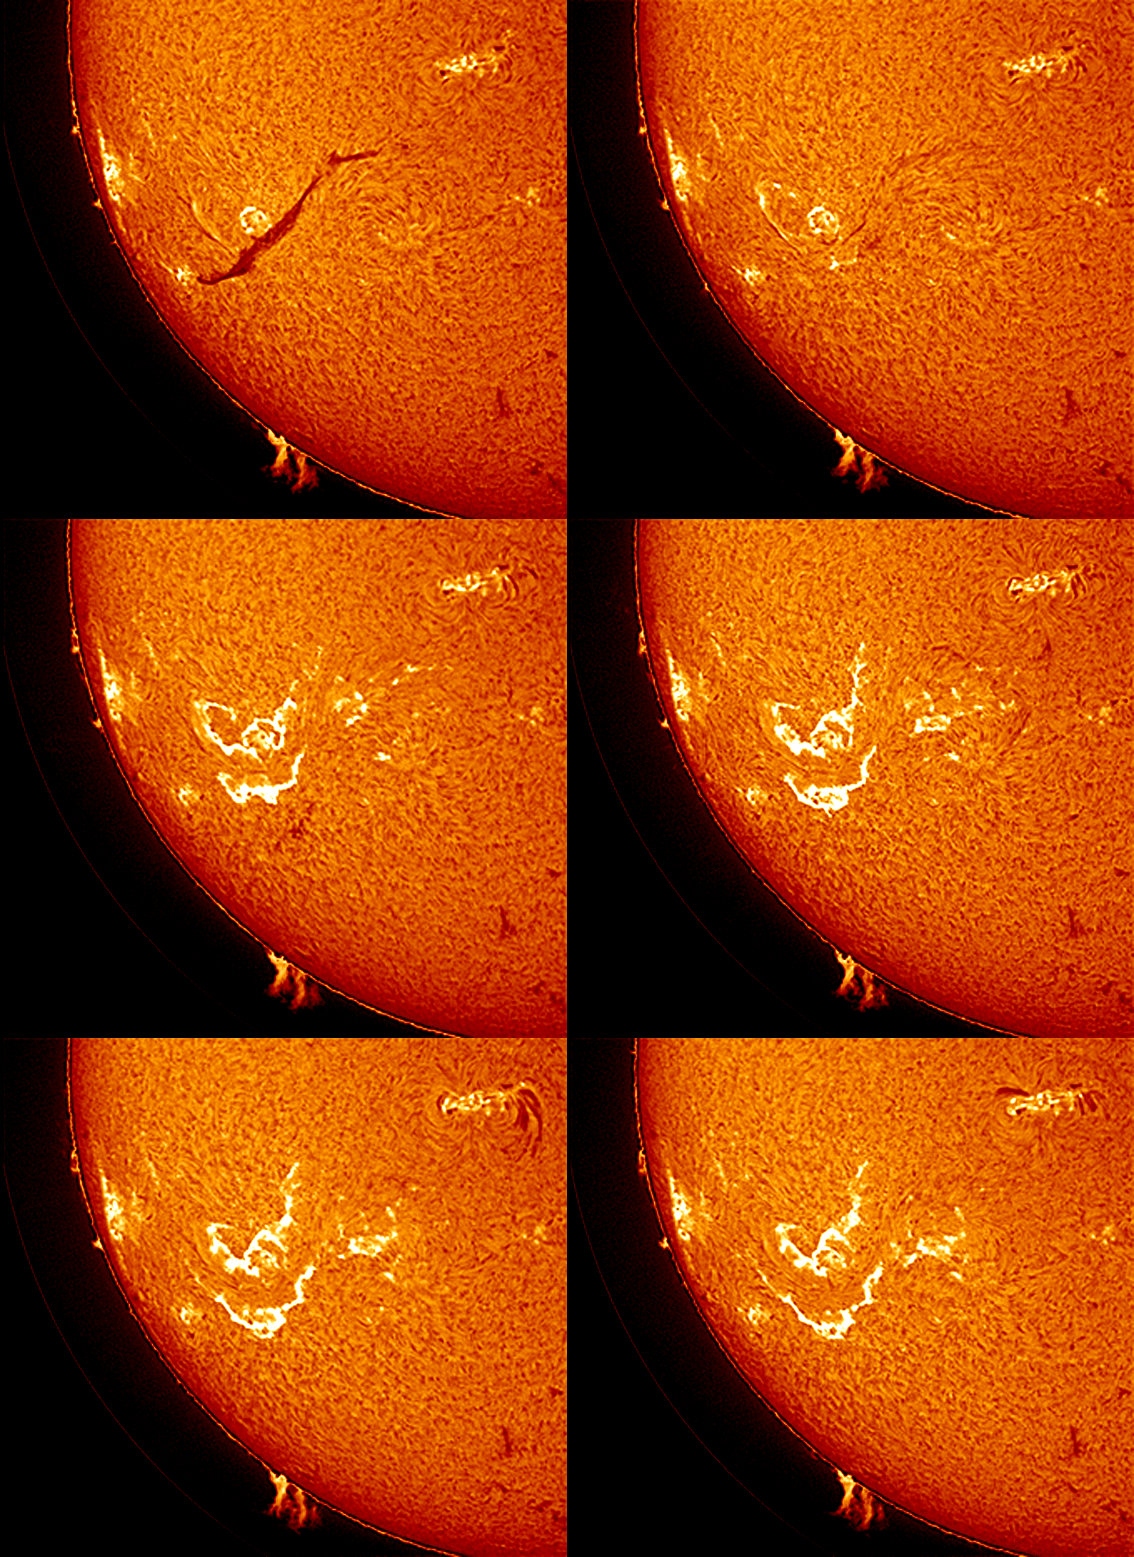
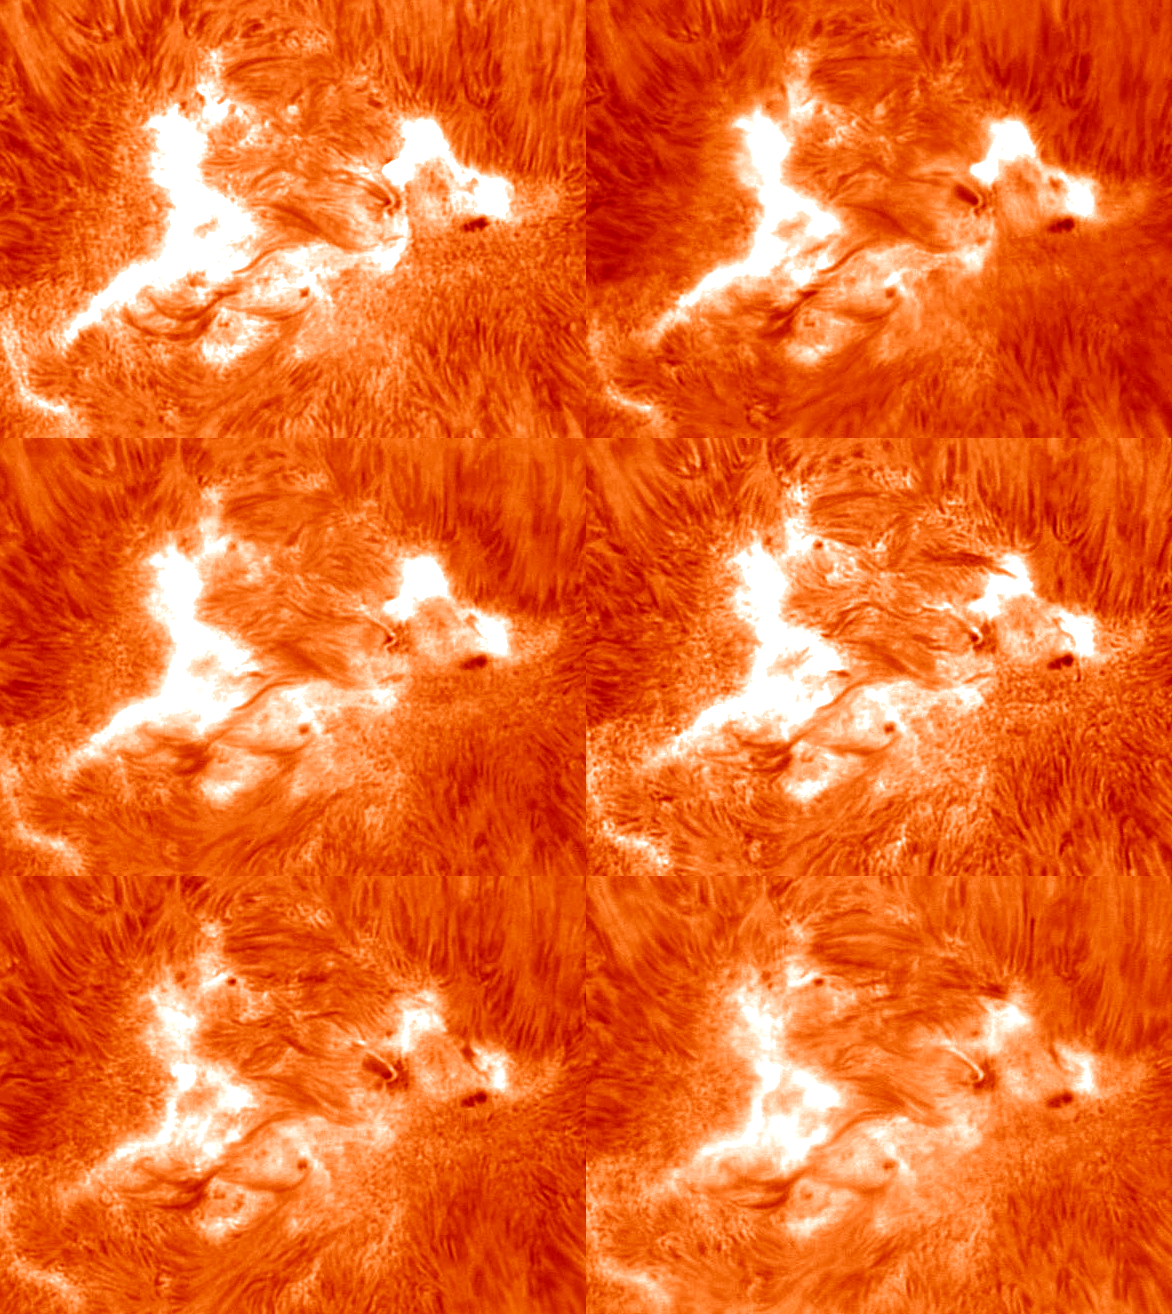

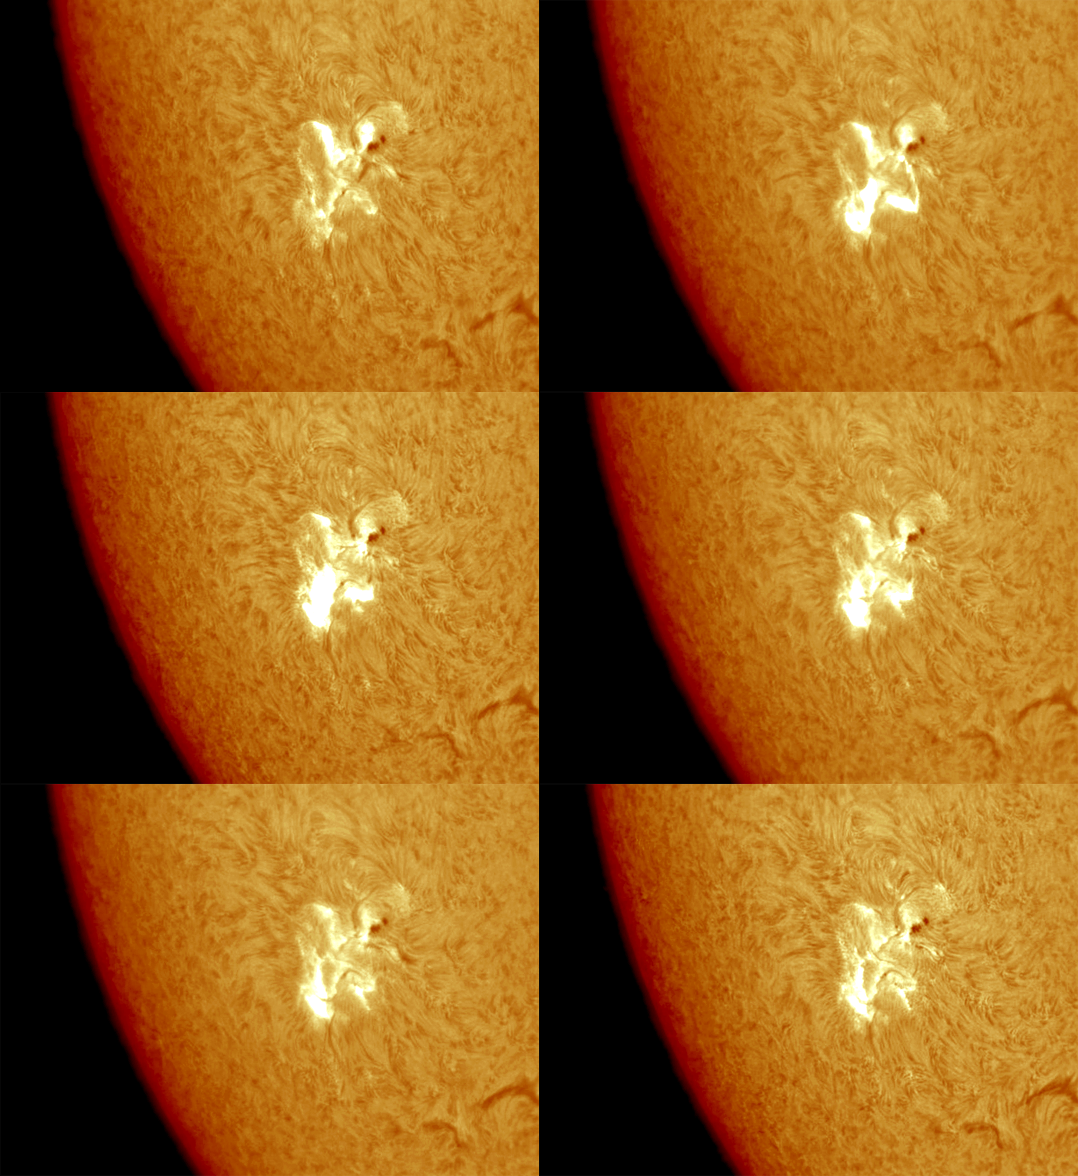
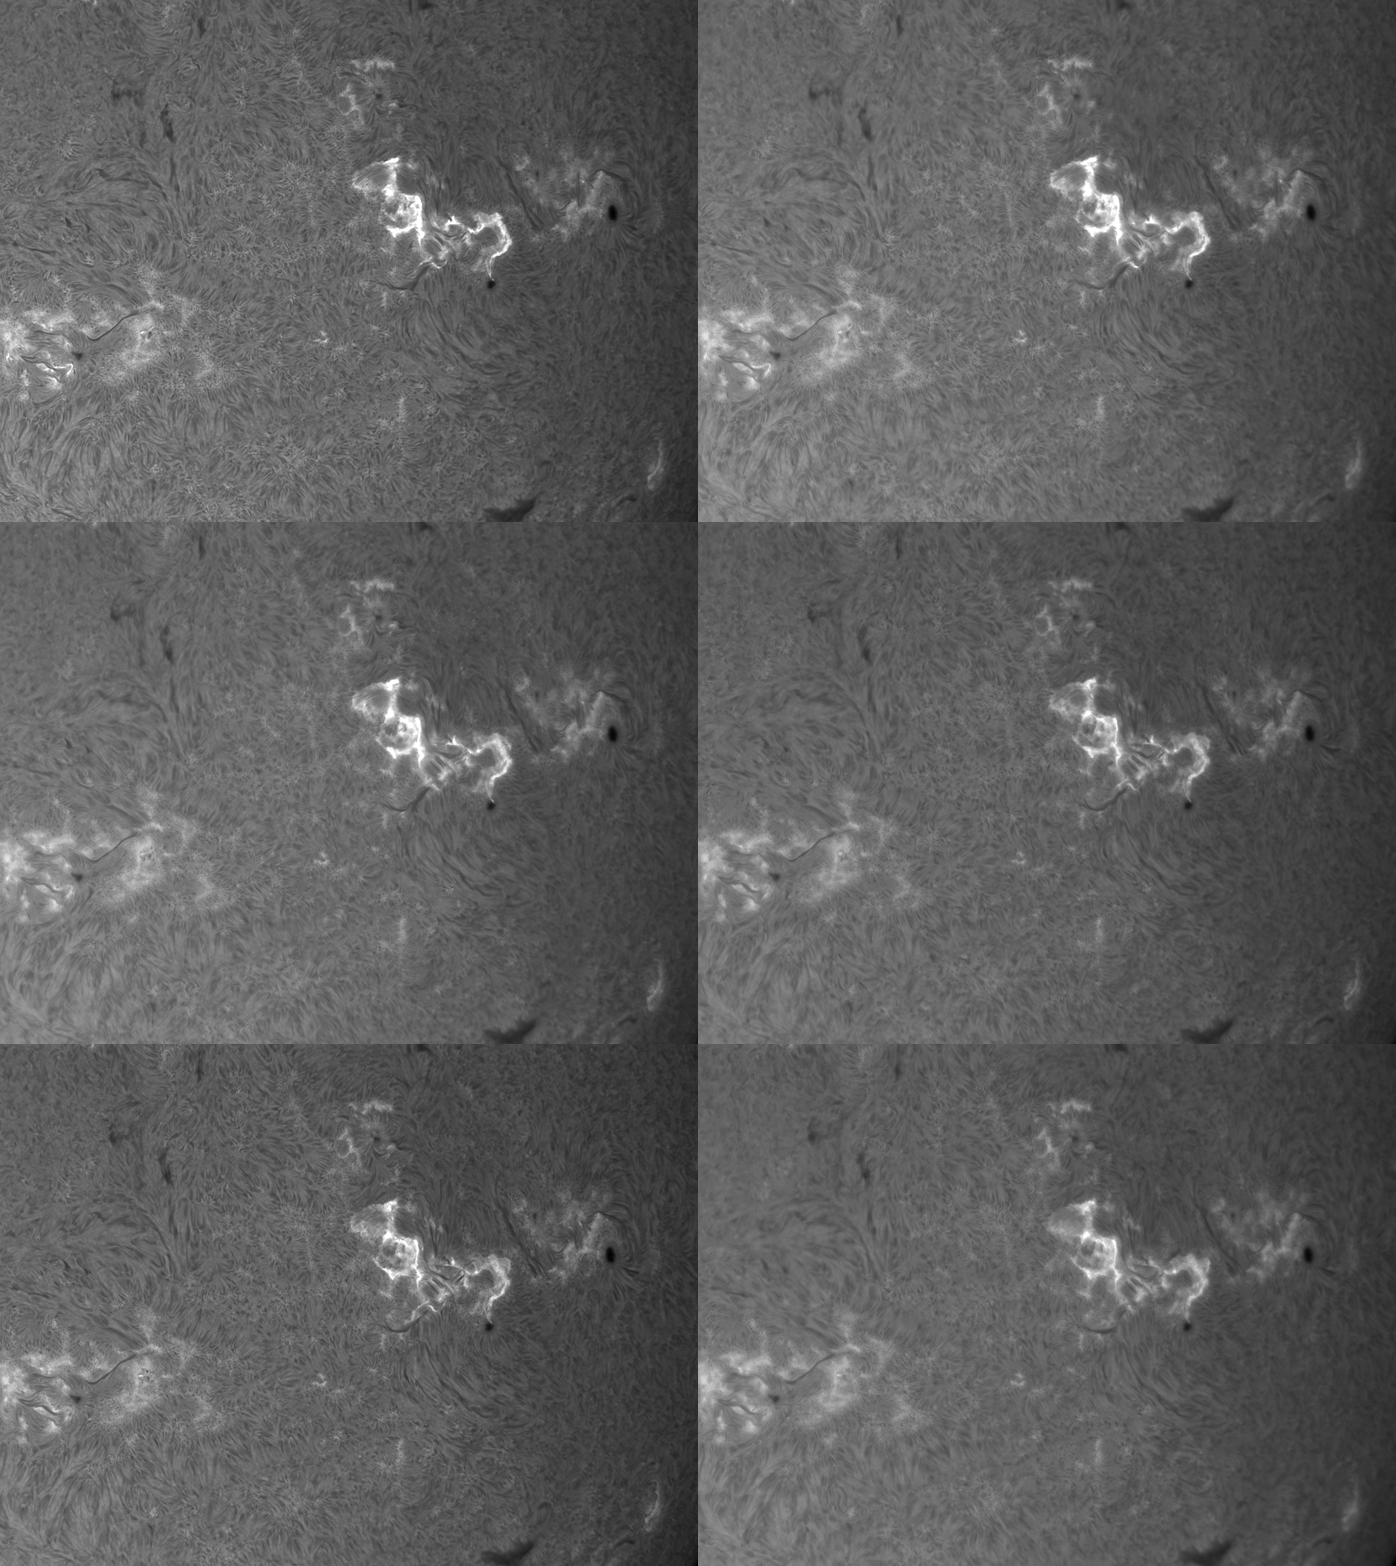
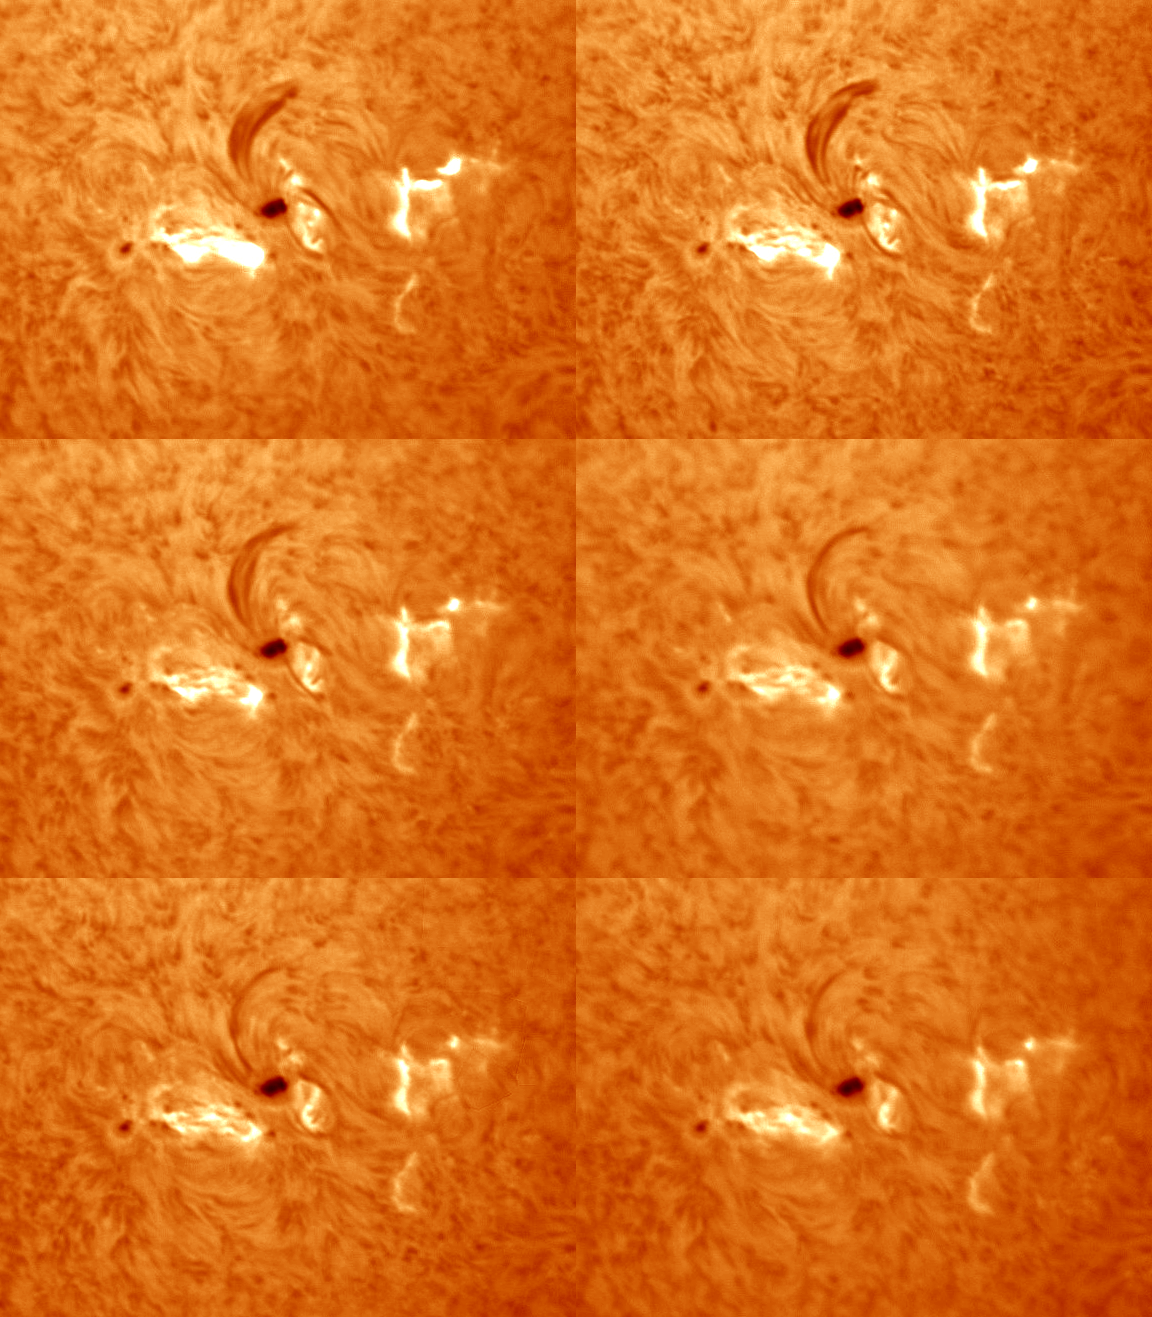
C7.2 Post flare loops

C7.9 & C3.6 in CaK light

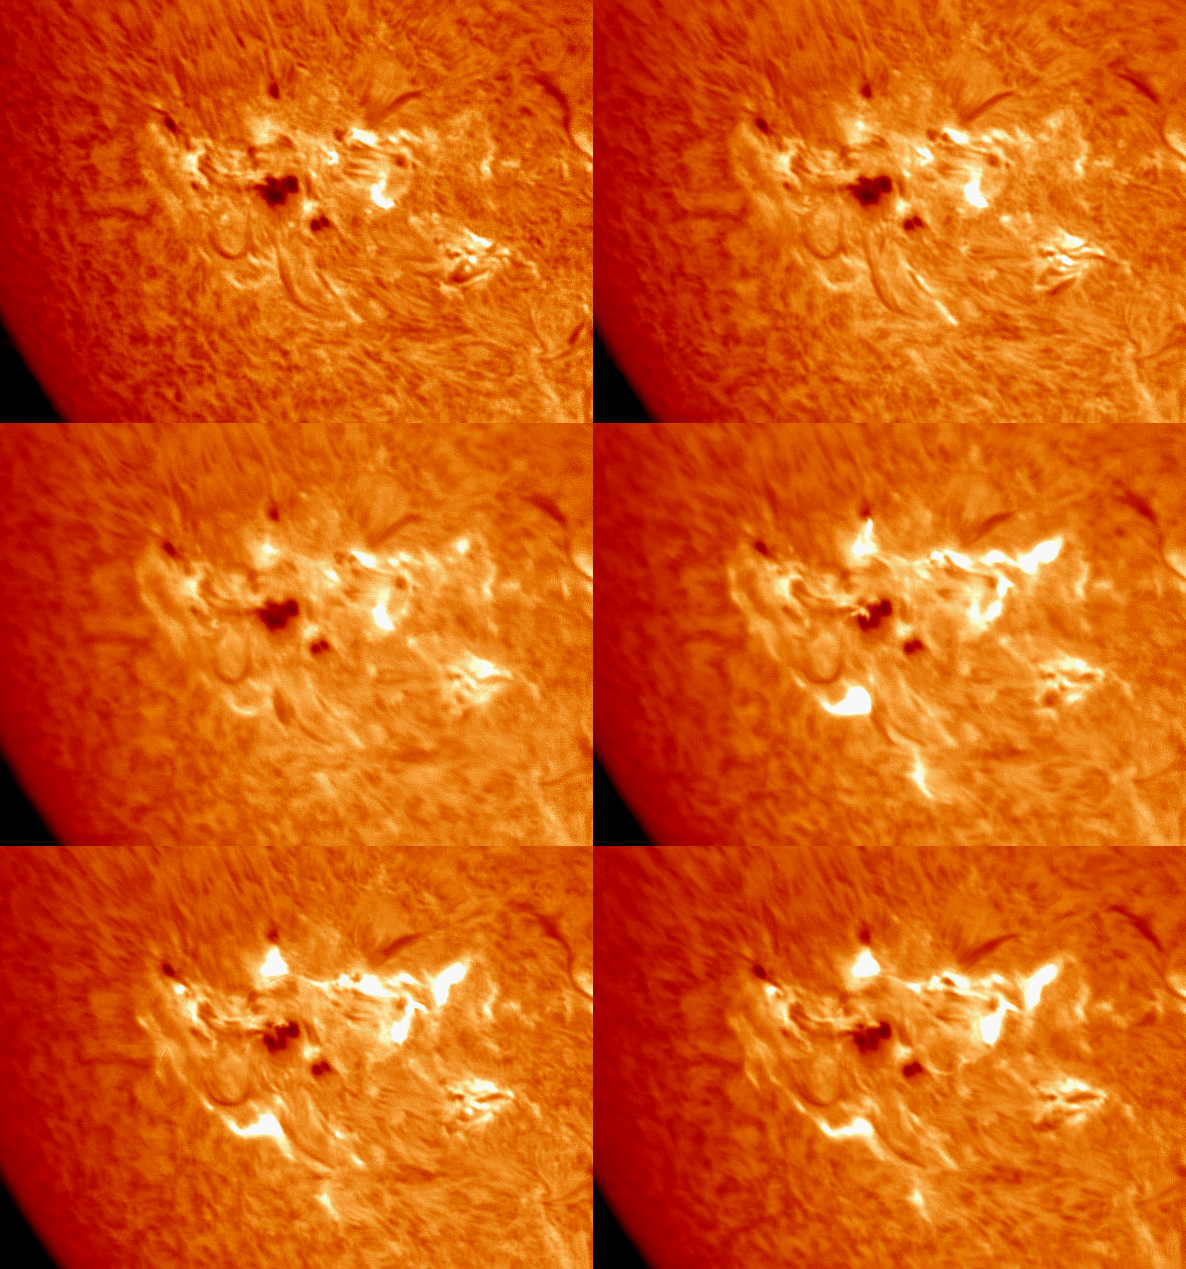

C5.8 Post flare loops

C5.2 and surge prominence


C4.9 Post flare loops


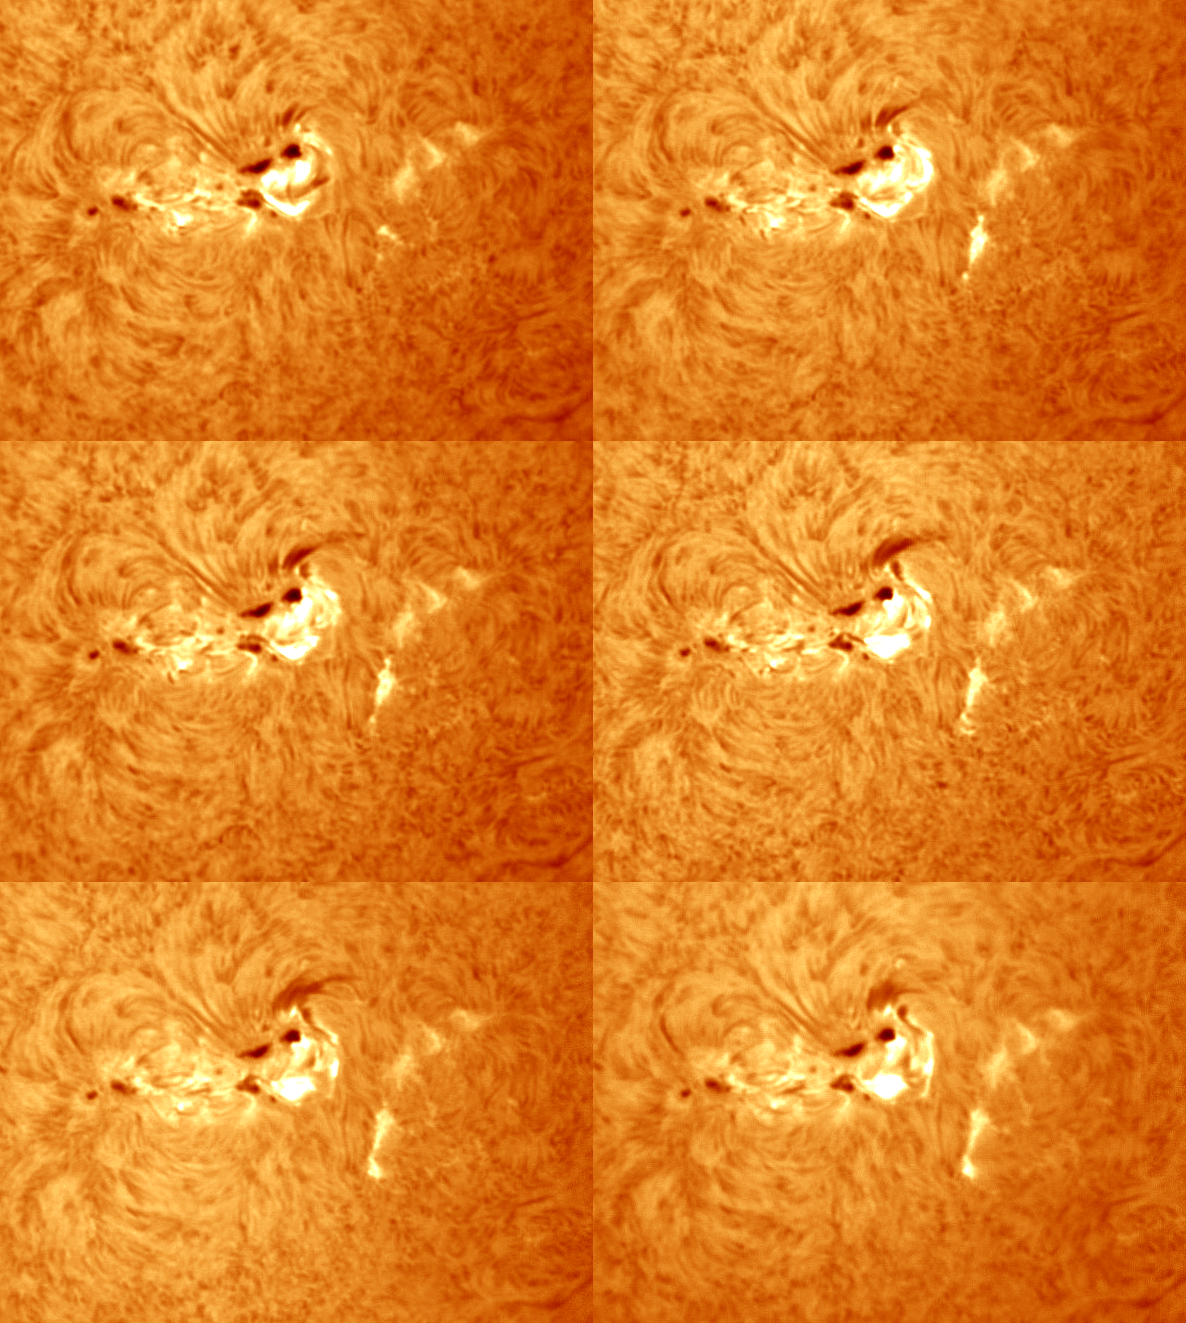
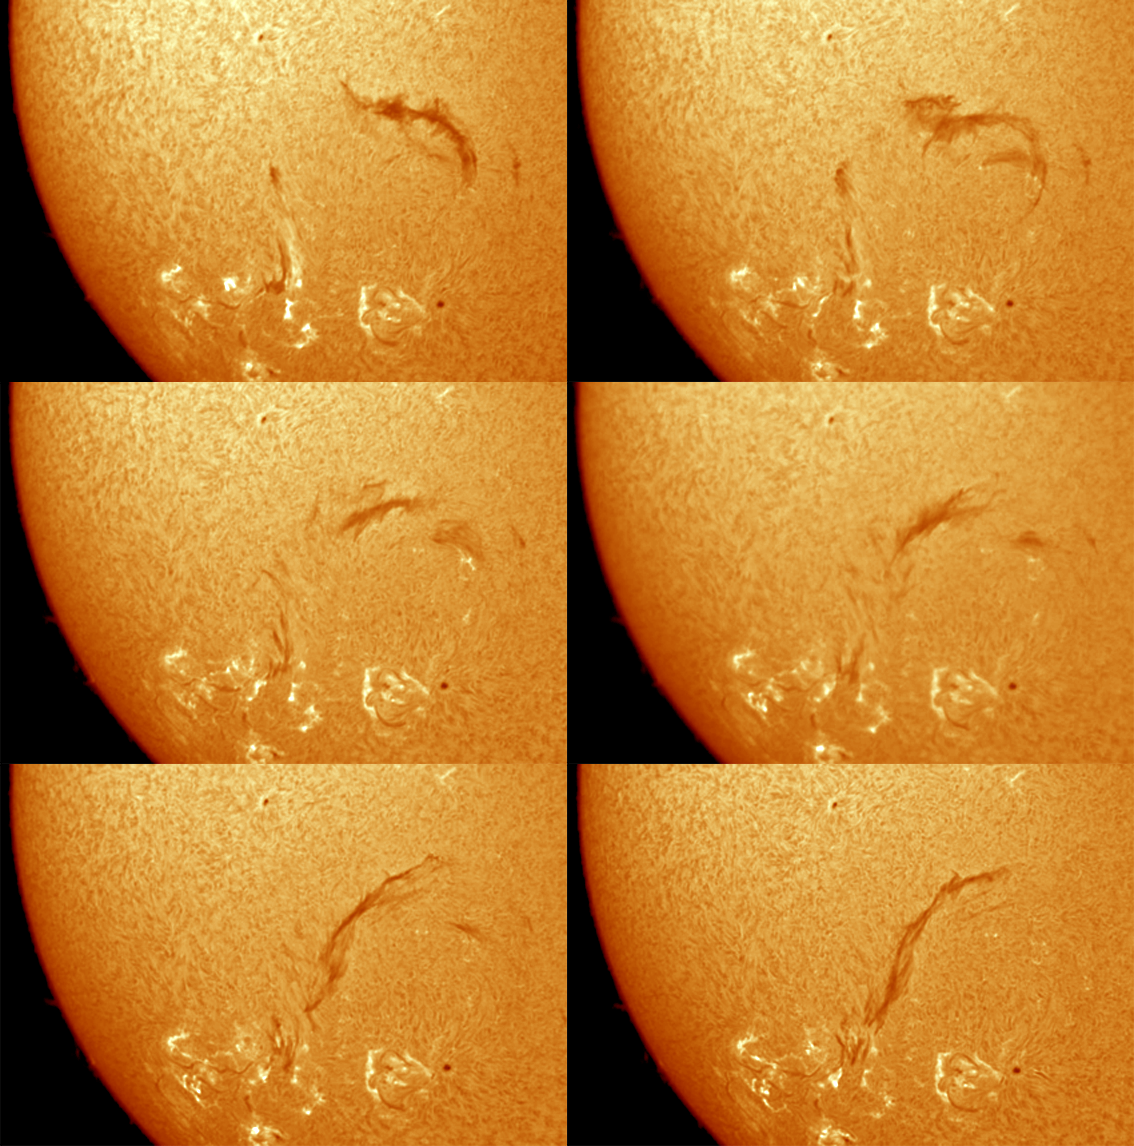

C3.2 GONG
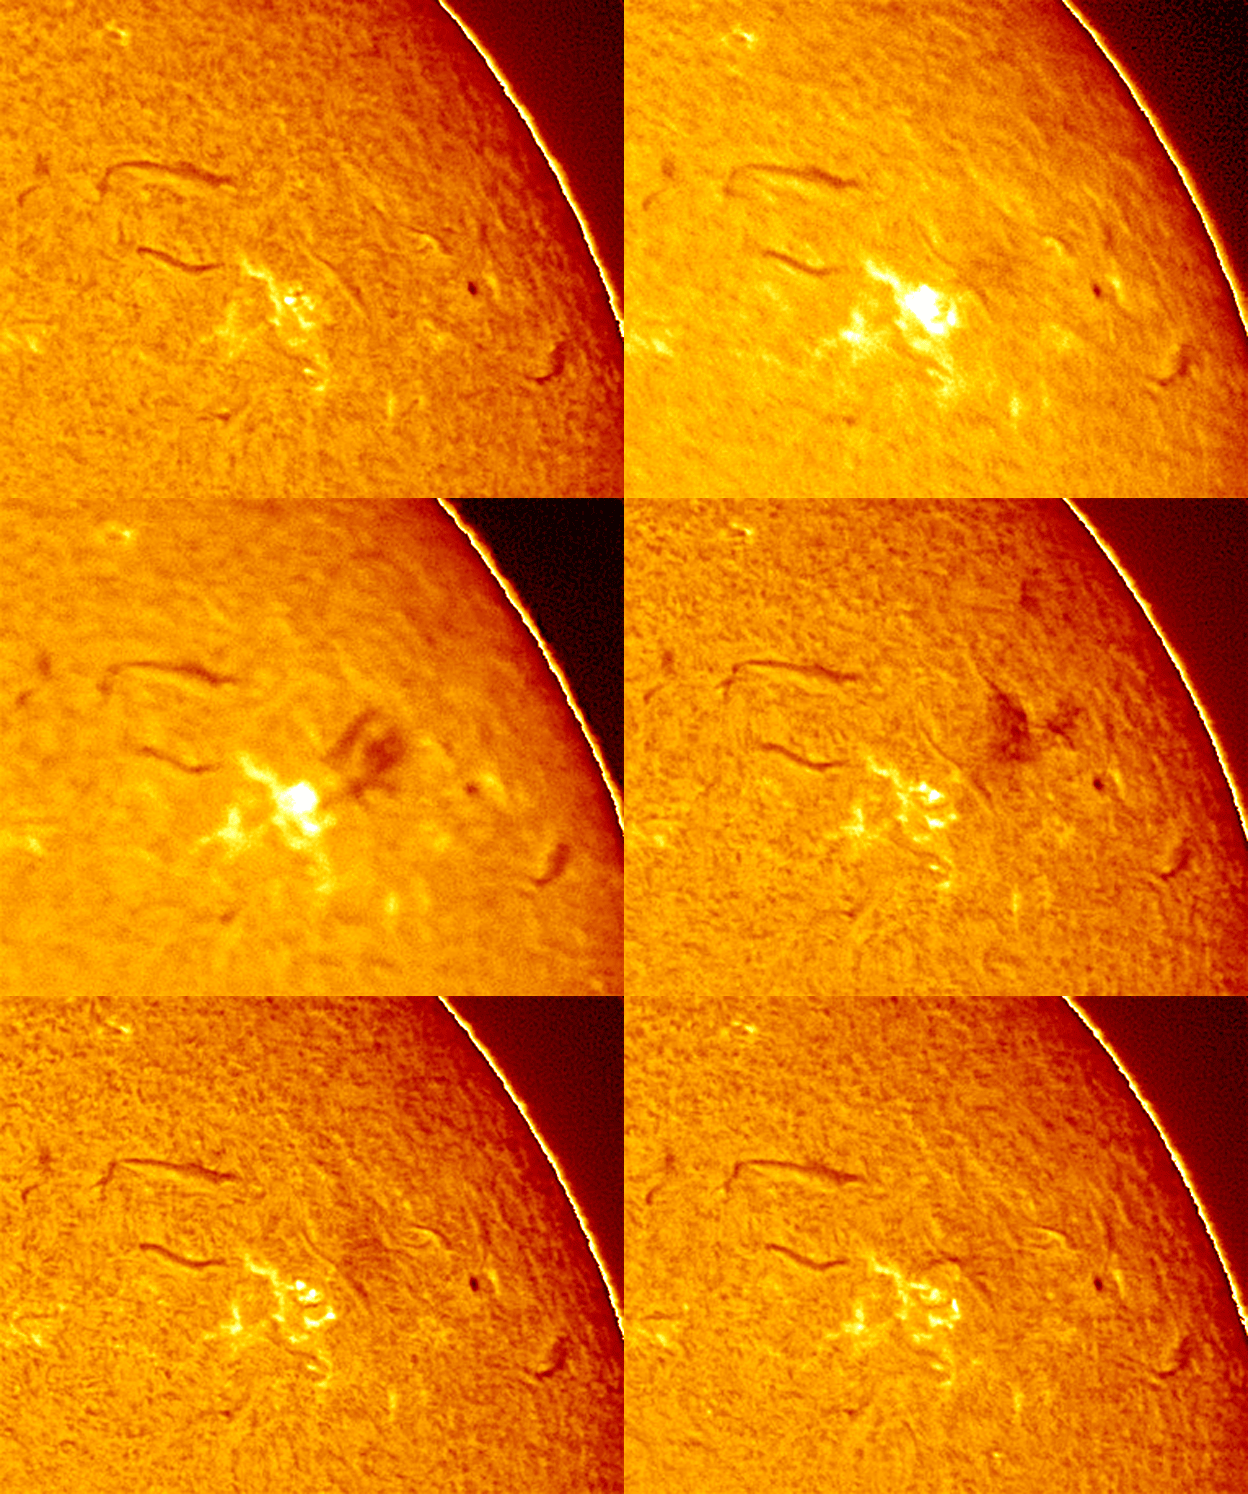


C2.7 Post flare loop

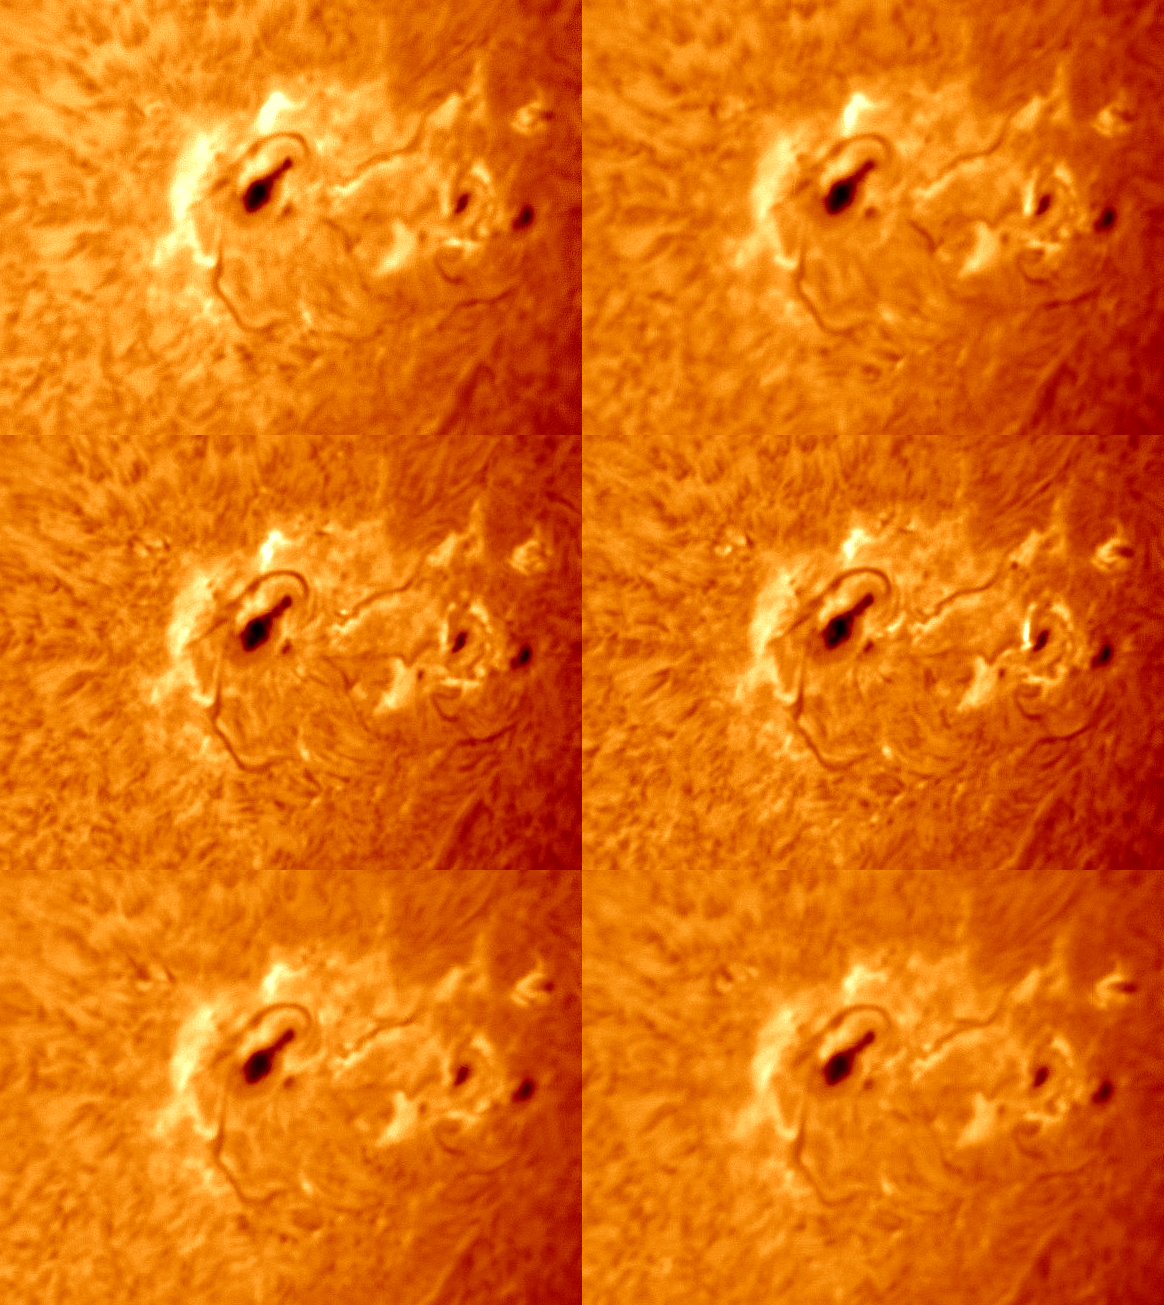


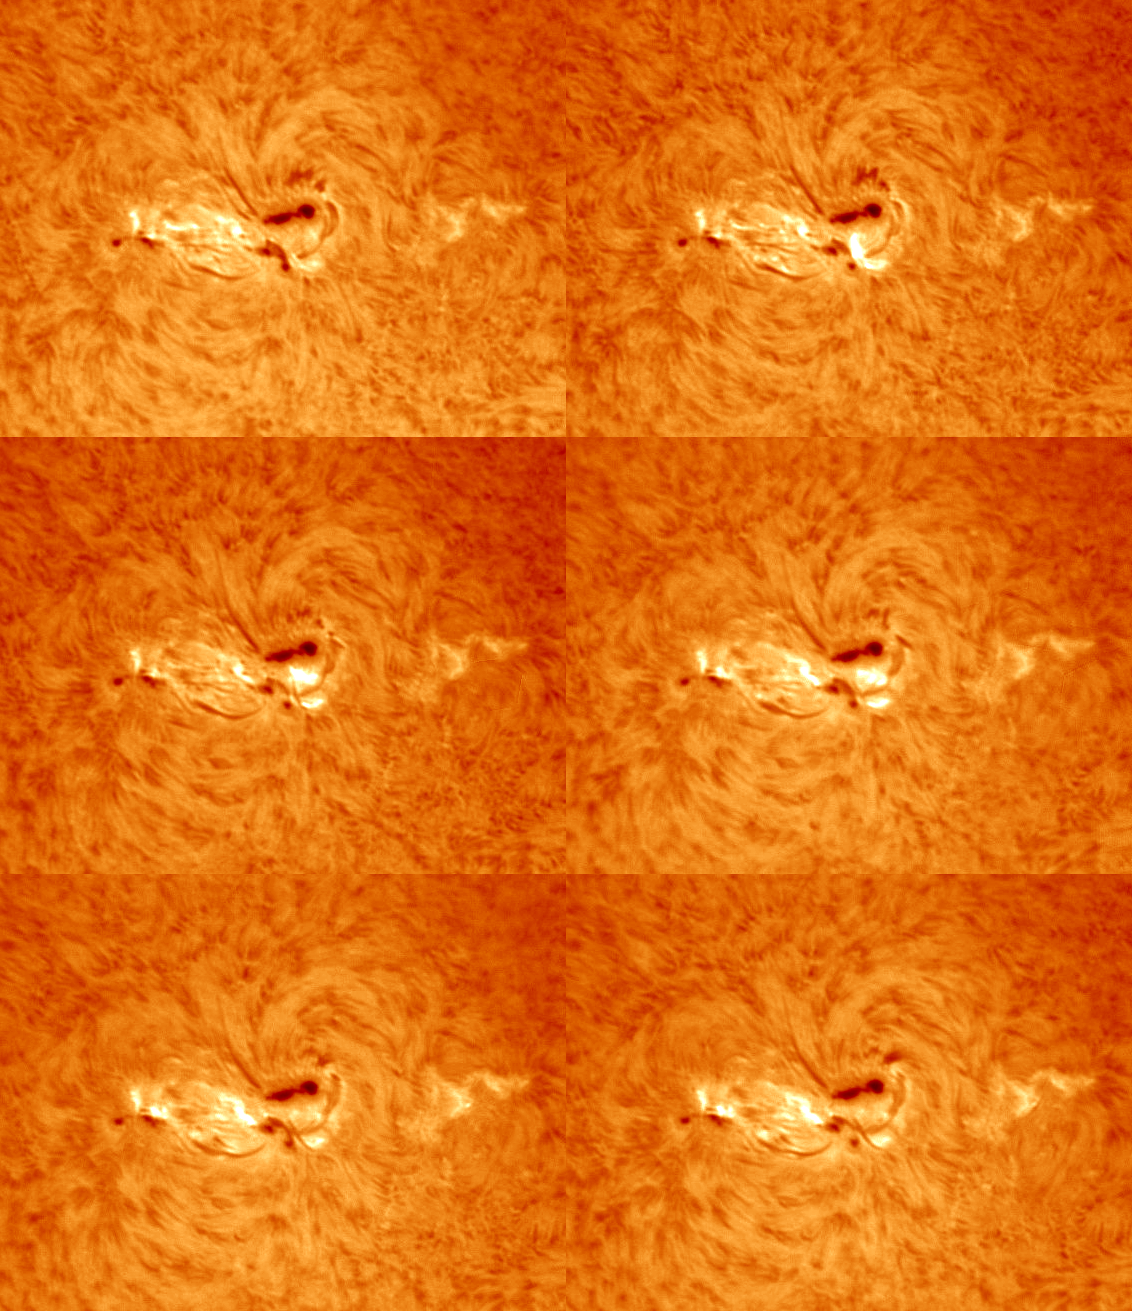
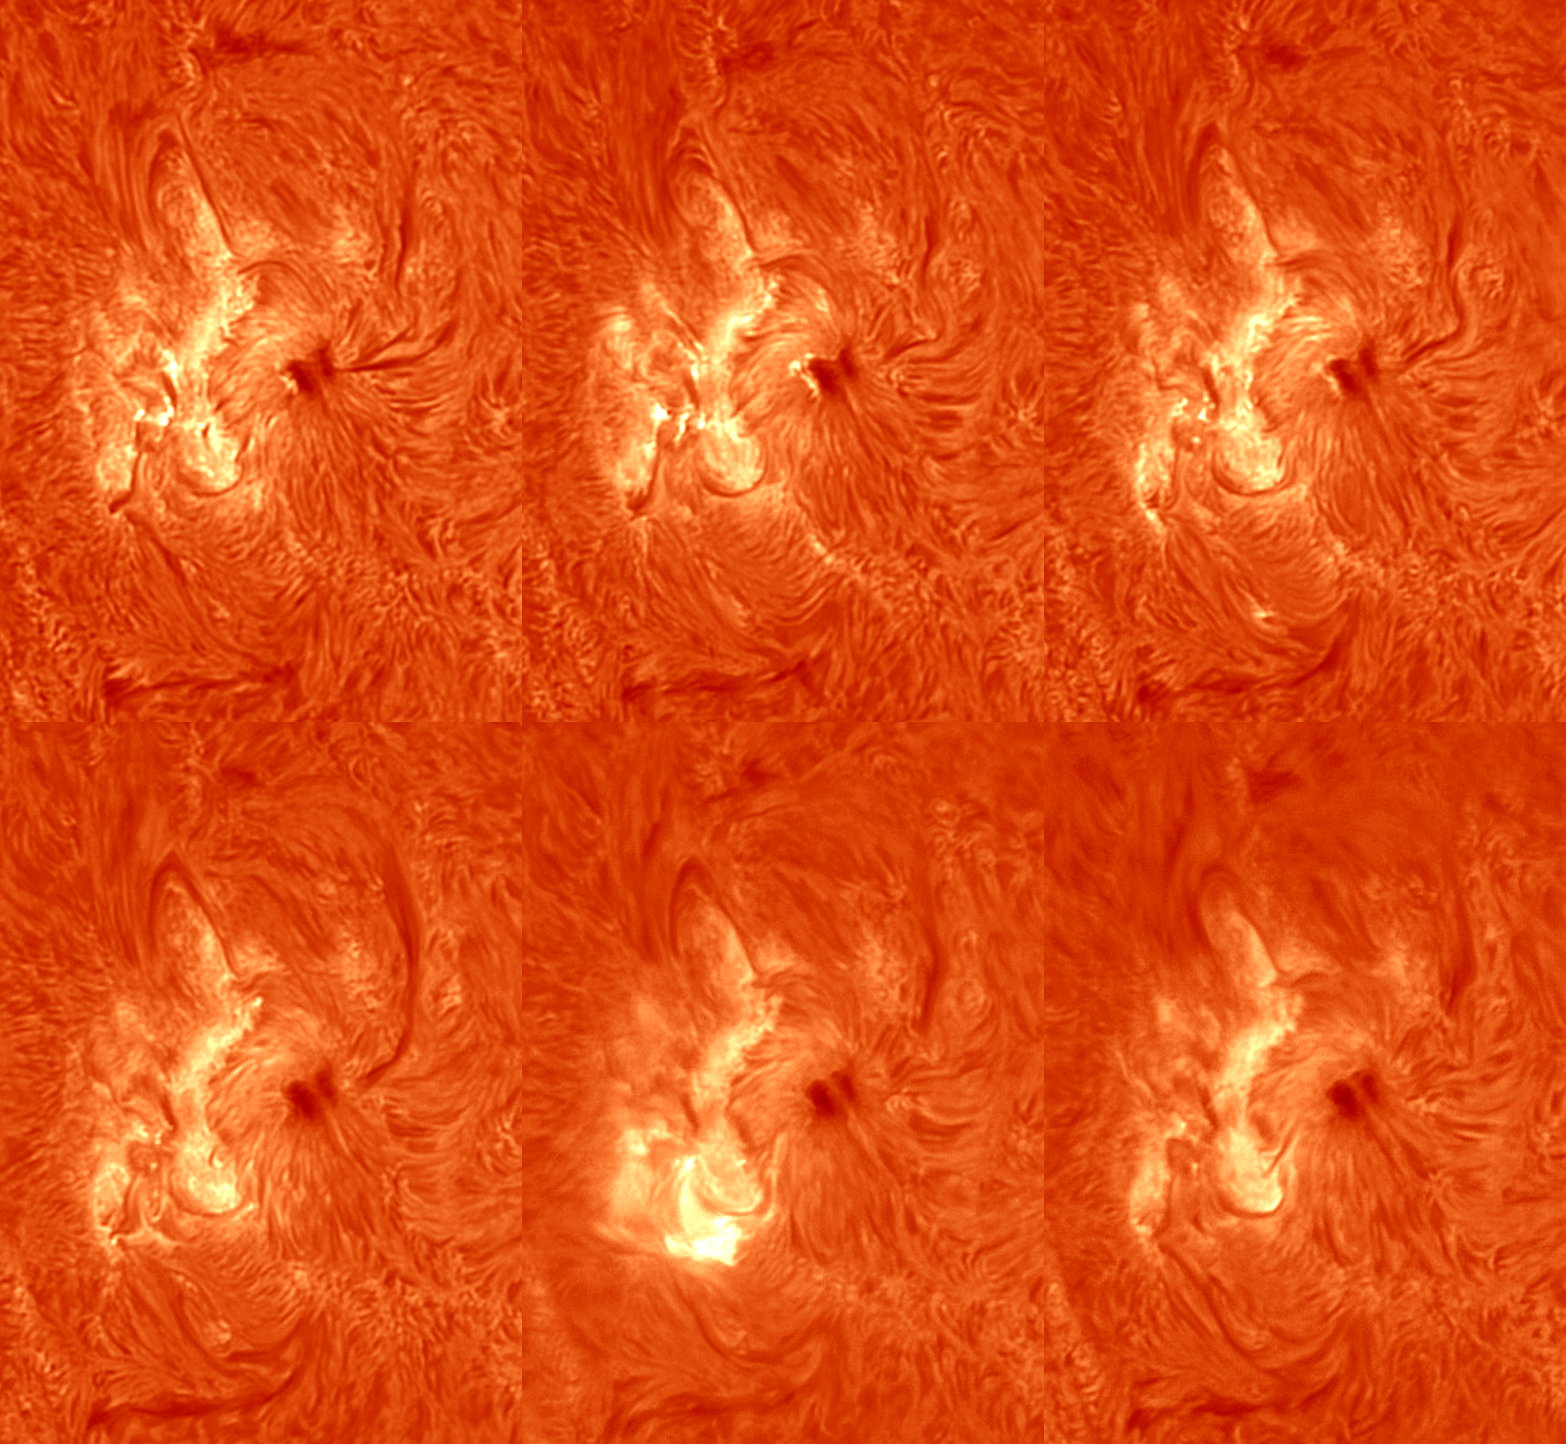


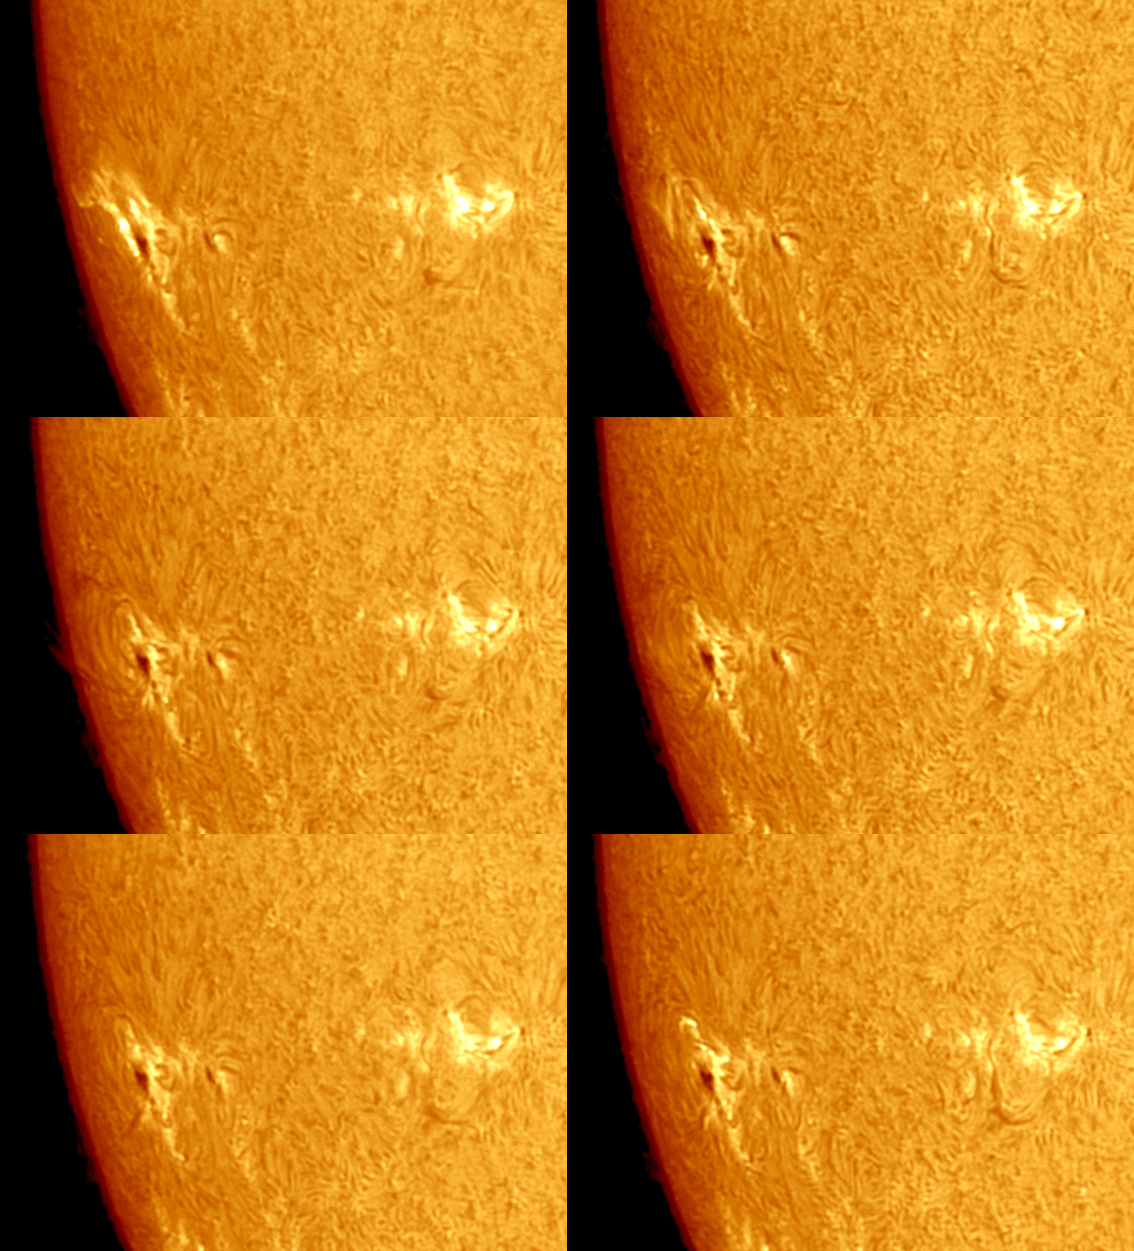

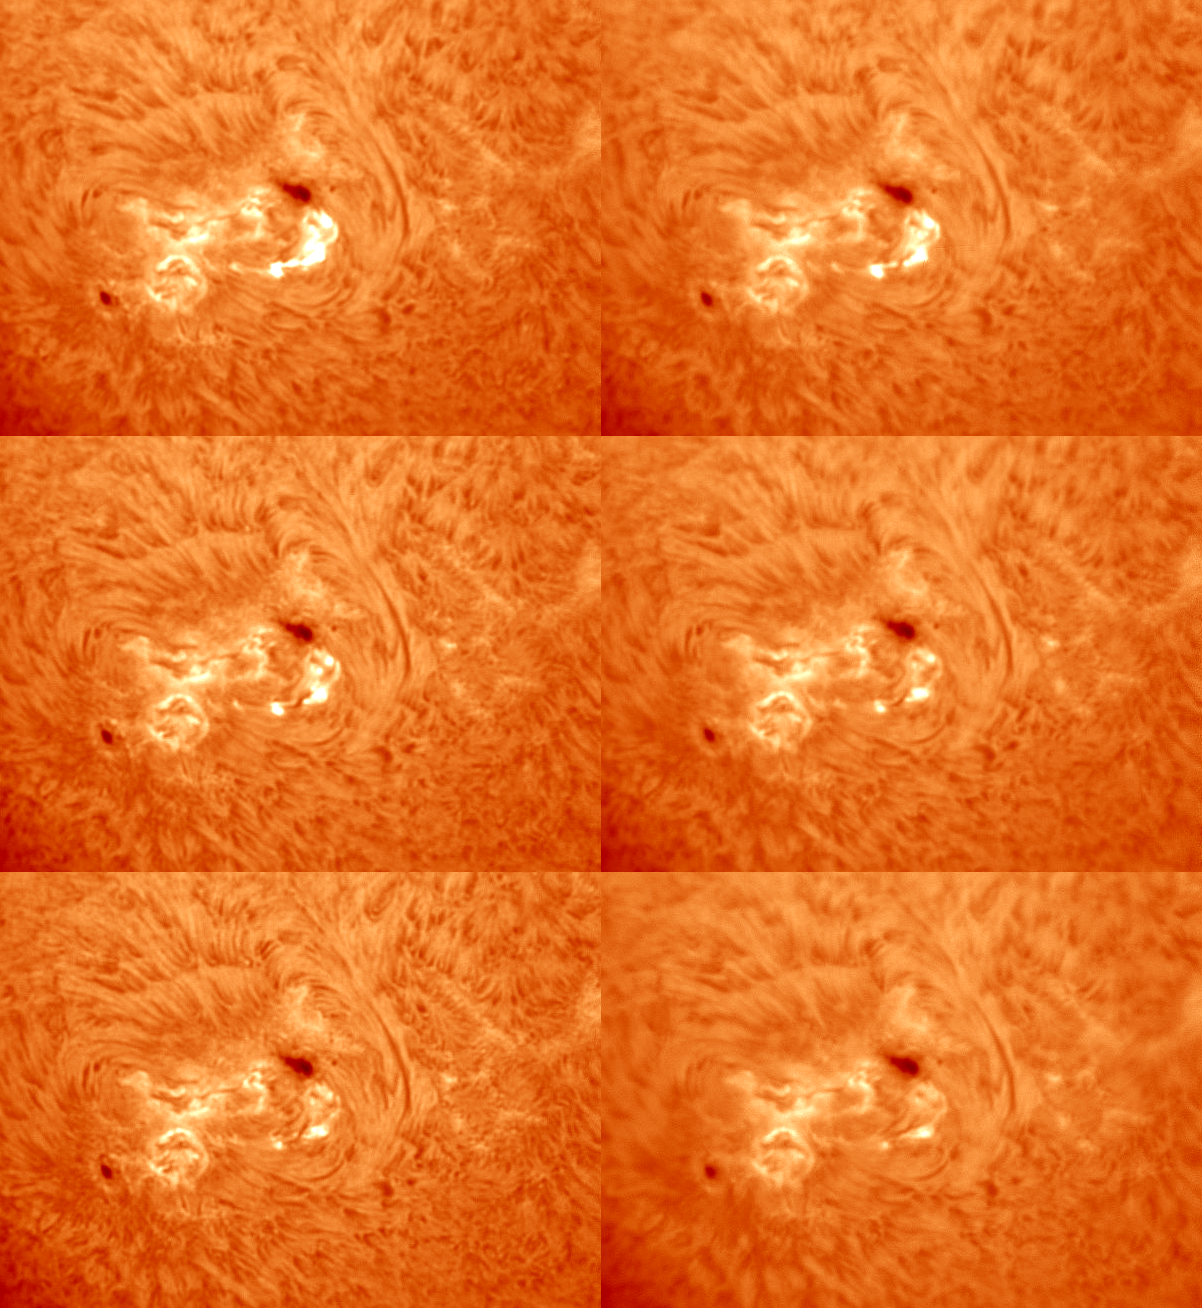

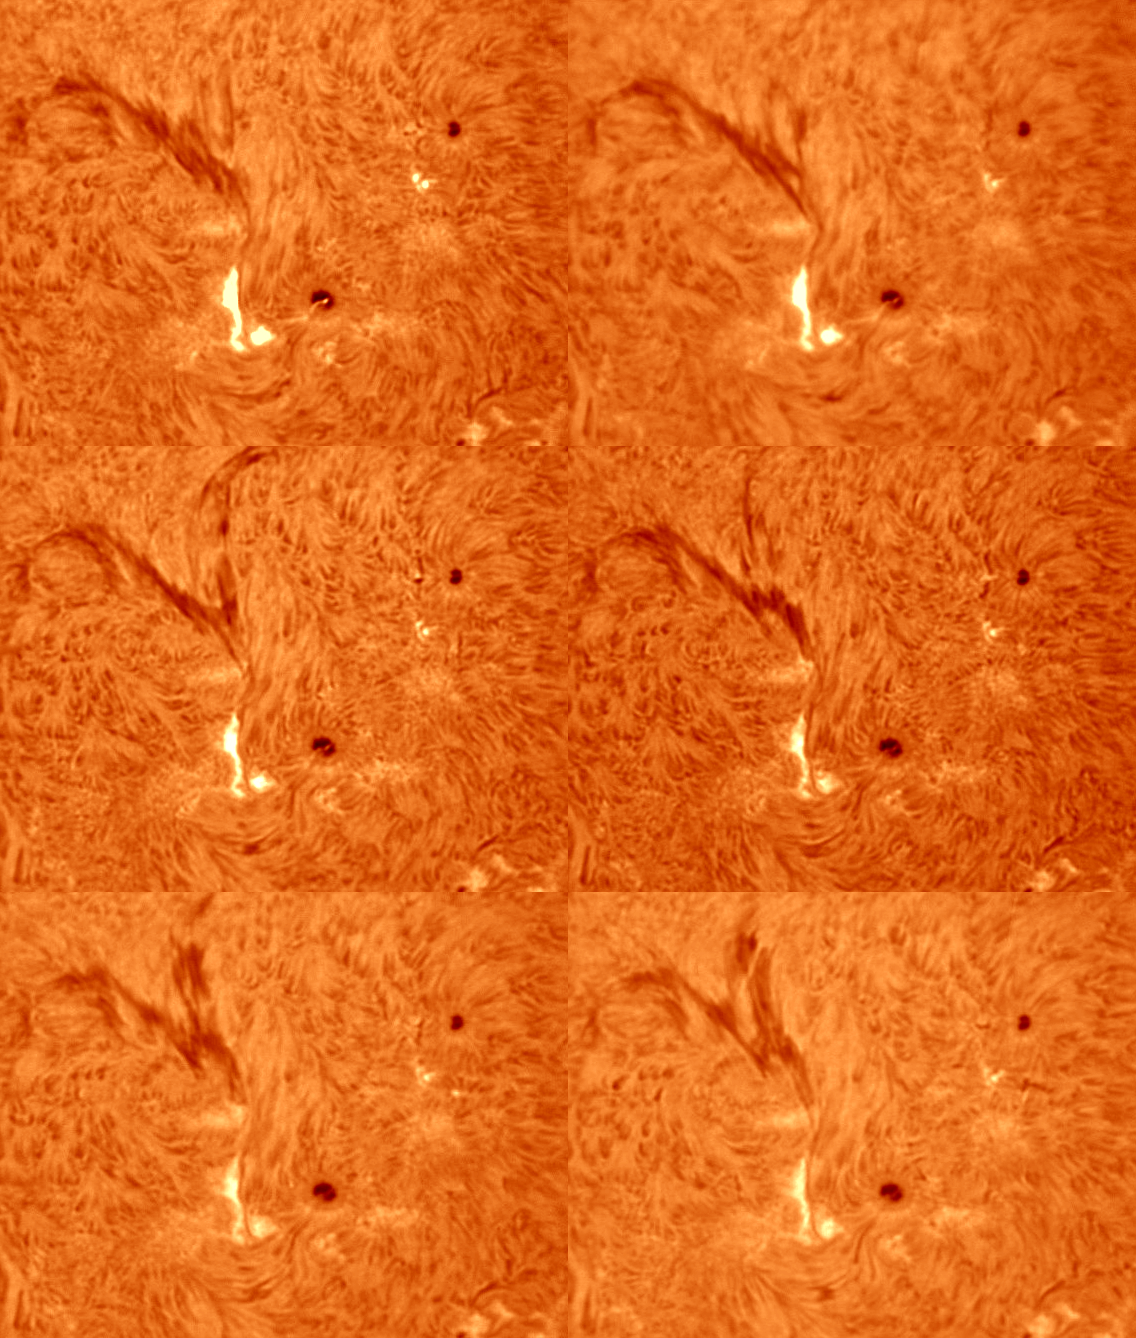


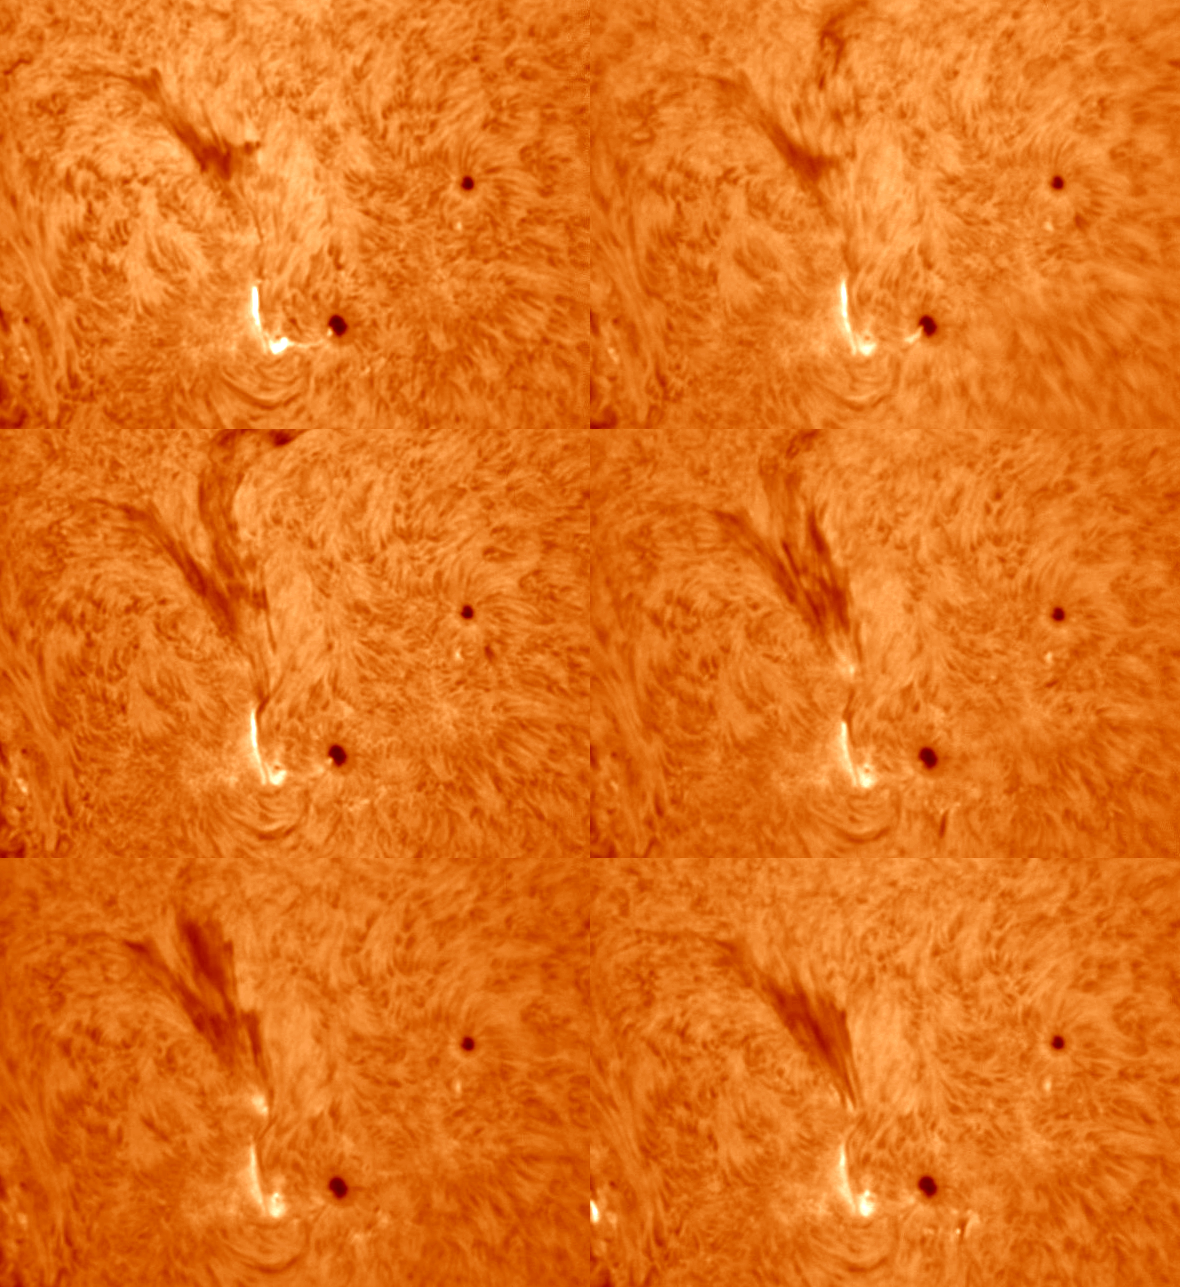


Here is a link to view the record setting solar flares back to 1976.
Here I am attempting to locate any video, photos or scientific analysis links for them:
X?? 01/09/1859 [the largest flare/geomagnetic storm in recorded history]
X28+ [X45?] 04/11/2003 and another link
X20.0 02/04/2001
X20.0 16/08/1989
X17.2 28/10/2003
X17 07/09/2005
X15 06/03/1989
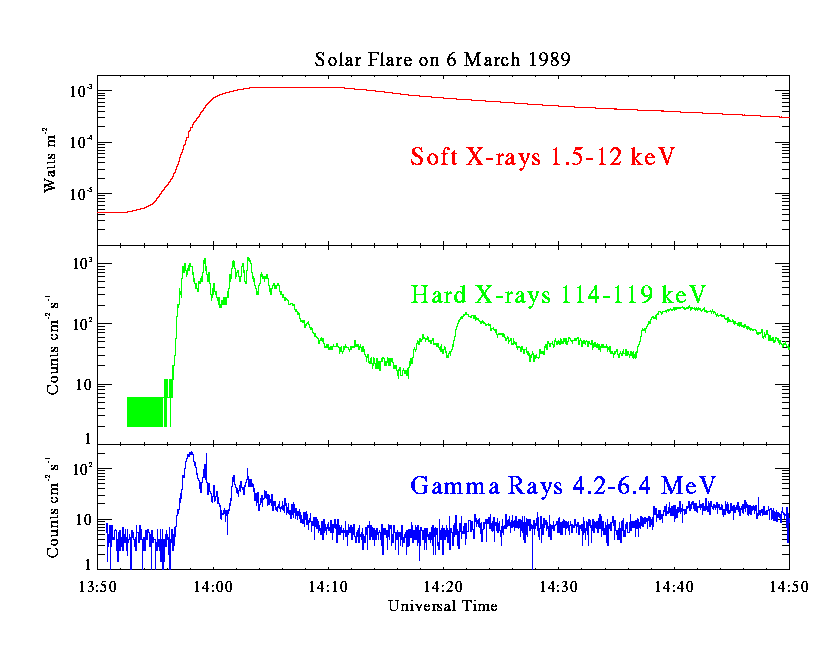
X15 11/07/1978
X14.4 15/04/2001
X13.0 24/04/1984
X13.0 19/10/1989
X12.9 15/12/1982
X12.0 06/06/1982
X12.0 01/06/1991
X12.0 04/06/1991
X12.0 06/06/1991
X12.0 11/06/1991
X12.0 15/06/1991
X10.1 17/12/1982
X10.1 20/05/1984
X10.0 29/10/2003
X10.0 25/01/1991
X10.0 09/06/1991
X9.8 09/07/1982
X9.8 29/09/1989
X9.4 22/03/1991
X9.4 06/11/1997
X9.3 24/05/1990
X9.0 05/12/2006
X9.0 06/11/1980
X9.0 02/11/1992
X1.5 21/04/2002 TRACE video
Here is a very useful source of reference
Here is a very useful link chronicling white light flares
Archive of the most severe geomagnetic storms